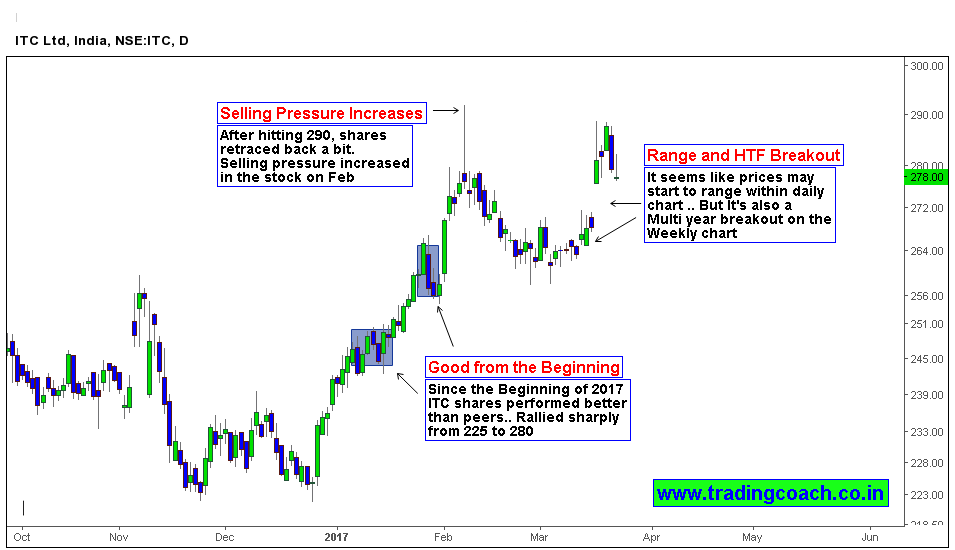
ITC Share prices have performed relatively well since the beginning of this year. Stock prices rallied from 225 to 280, within a period of 45 trading days. On daily chart, Price action has broken the resistance level at 260.00 and currently consolidating above that, but also failed to break the decision point at 290.00. There’s a possibility that stock prices might range for a while, as there is both supply and demand in the stock at key levels. The structure is more interesting on weekly chart.
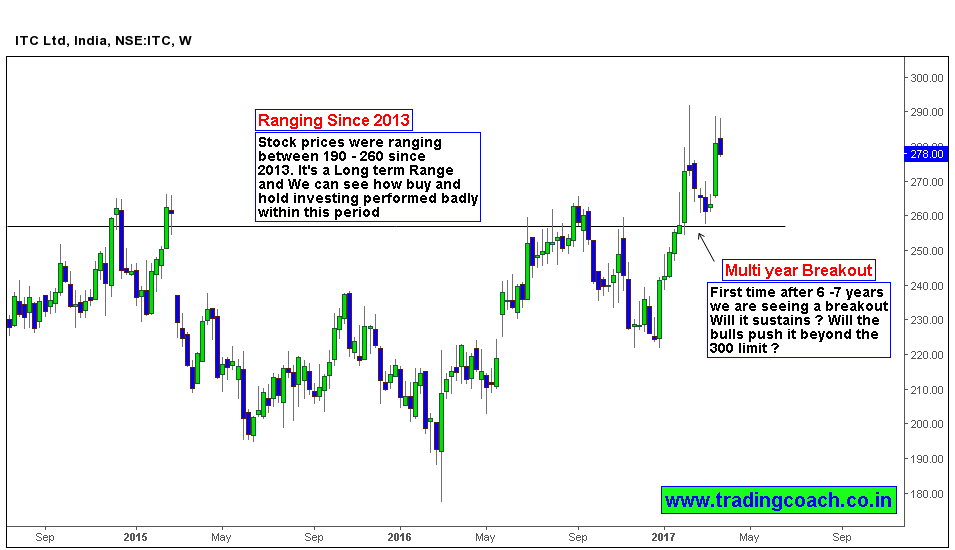
When we look at the weekly chart of ITC, we can spot the market ranging since 2013 within 190-260. It’s a very long-term range and many investors are struck without any positive returns. It’s an unfavorable time to hold ITC in one’s Portfolio. But first time after 7 years of volatile range bound fluctuations, ITC stock prices have breached upper resistance level at 260.00. Thus forming a multi-year breakout, now the question is – Will the breakout sustains in coming months?
If bulls can survive in coming weeks there are possibilities of a new uptrend in ITC. So keep watching the price action to find trading opportunities.


