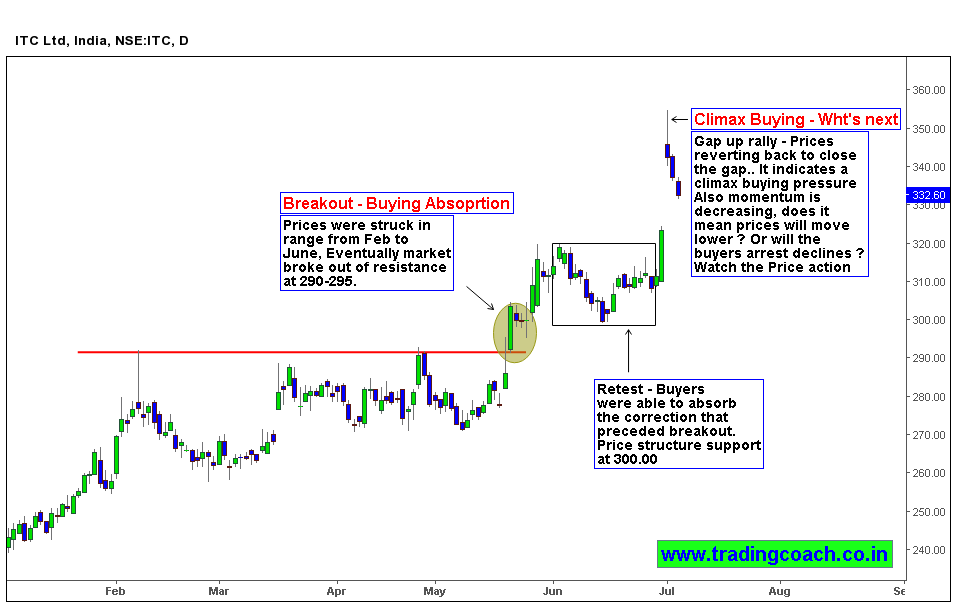
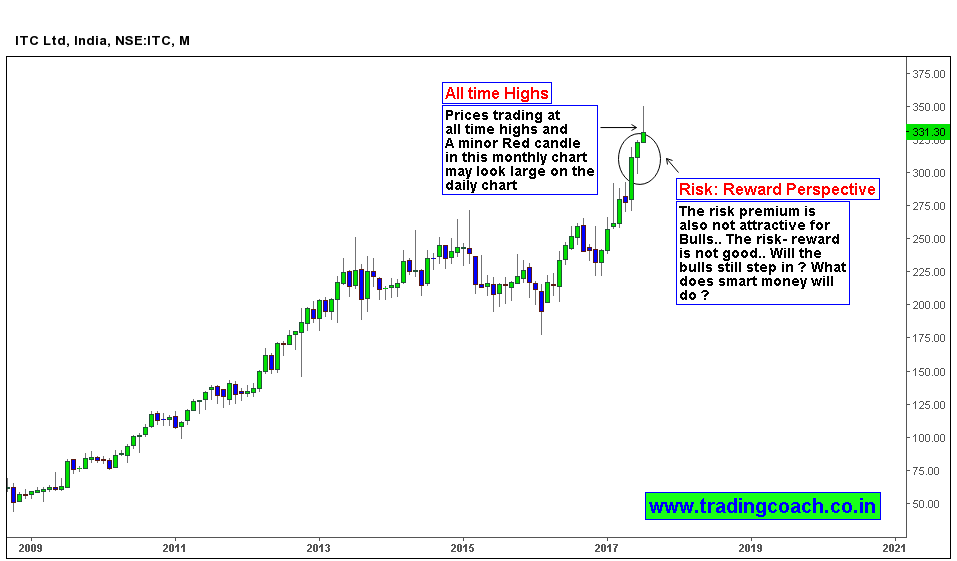
ITC Share prices traded in range within 260 – 295 from Feb to June; eventually prices broke out the resistance or range high and successively traded higher.Buyers absorbed the corrective selloff that succeeded Breakout and Market formed structural support at 300.00. (It’s also a psychological round number) But one important fact is – This breakout accommodates continuation of Uptrend which is at all-time highs! Have a Look at this chart of ITC (Higher time frame)
So, further advance in ITC brings the risk of strong liquidation or pullback in higher time frame, which can manifest as intermediate correction in trading time frame! In daily chart, we see a noticeable gap up from 320 – 350 which the market is trying to close. If you remember technical analysis 101, this is a classic example of Runaway gap which indicate buying climax (More buyers but decreasing sellers, which can flip the prices exactly opposite if Buyers liquidate their trades). The location of this Runaway gap also takes an important significance. Does it mean prices are poised to move down? Or Will the Buyers step in and arrest declines? How about the GST effect? Watch Price action and trade once the picture is clear.

