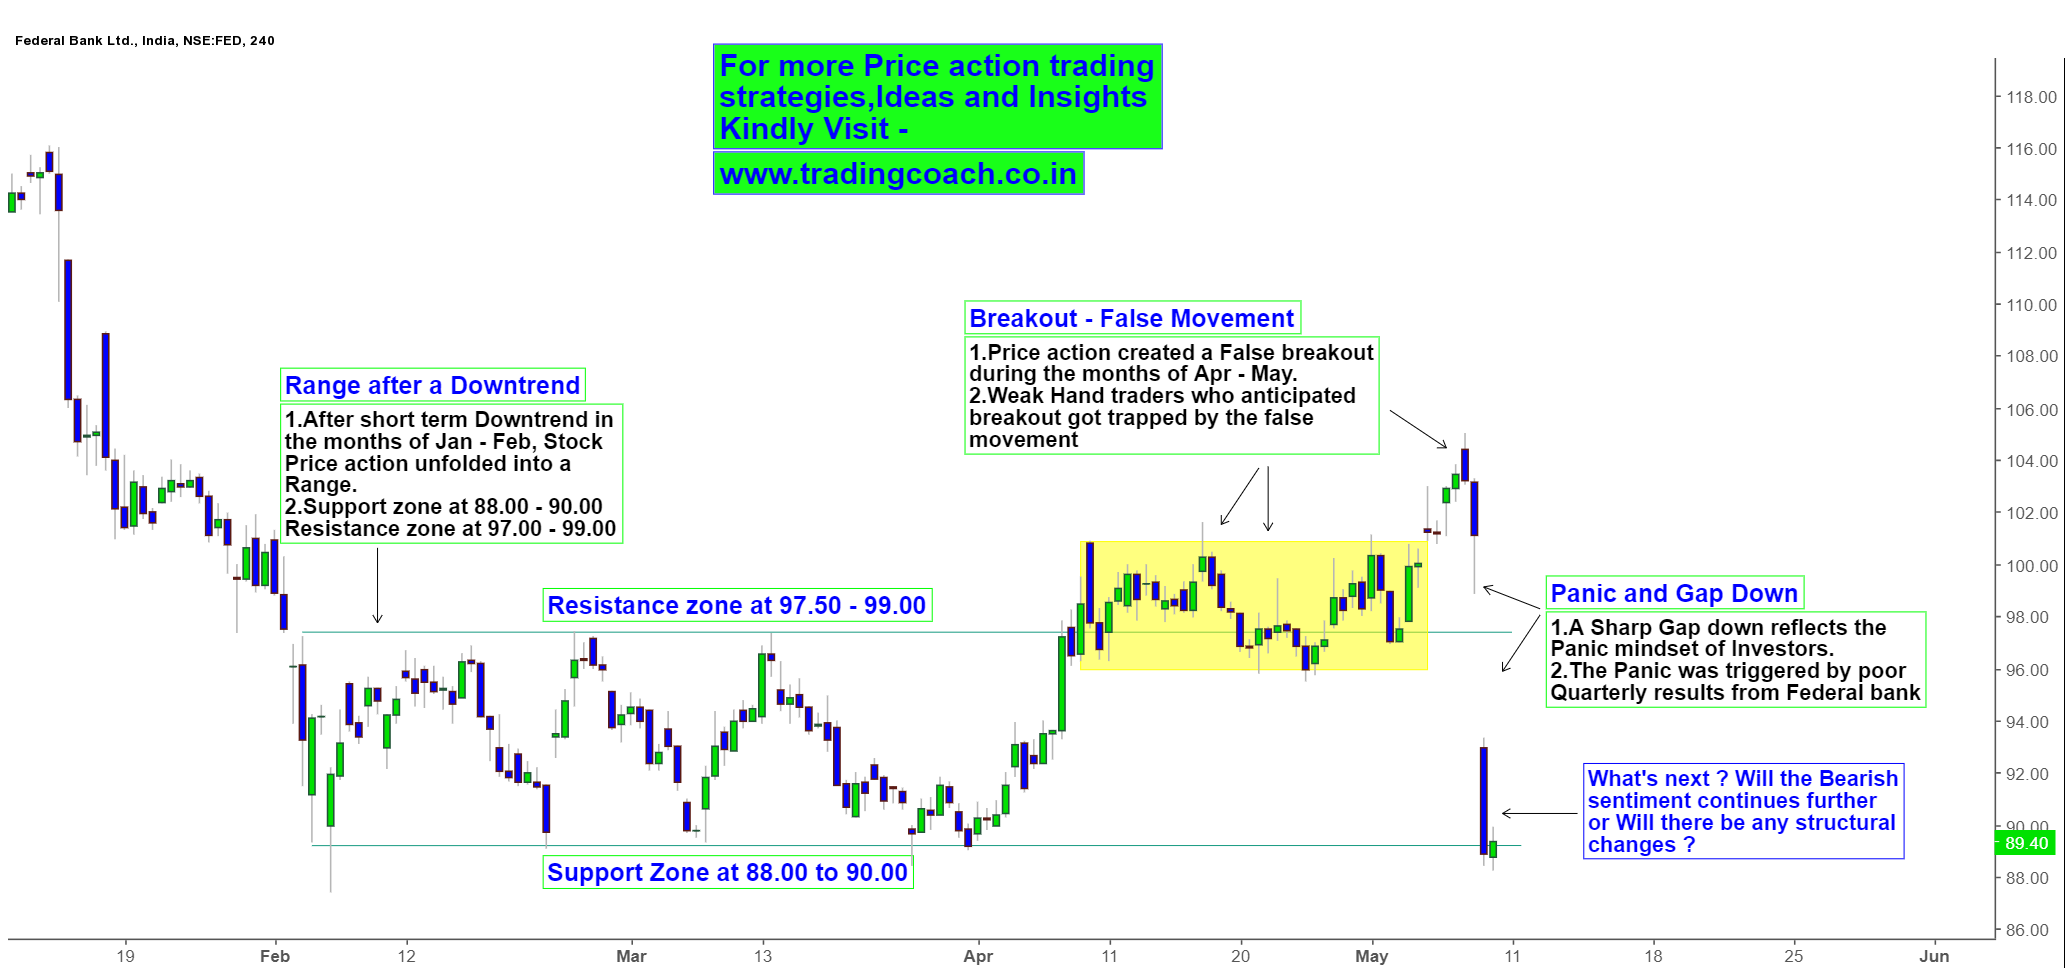
Federal Bank Share prices fell sharply in last two trading sessions. General Market psychology is indicating Panic Mindset of Market participants. We saw the same kind of Market behavior on other stocks recently. For e.g. Indigo Share prices tumbled heavily after poor Quarterly results. Now Federal Bank is following same route, 4h chart clearly shows the present Market conditions.
Federal Bank Share Price Action Analysis on 4h Chart
Share prices were in Downtrend during the months of Jan – Feb. Downtrend terminated into Sideways or Range bound market in Mid-February. Price action unfolded into Structural range, formed technical support zone at 88.00 – 90.00 and resistance zone at 97.50 – 99.00. Also please note that resistance zone is close to round number key level 100.00.
In the Month of May, after some extended consolidation near resistance zone (highlighted in yellow mark) Share prices broke the resistance and later turned into a false breakout. This unexpected price action trapped weak hand traders and forced them to liquidate their positions at absolute losses as prices fell sharply within 2 days.
Right after the announcement of Federal bank Quarterly results there was a sharp gap down. This Sharp gap down simply reflected the Panic Mindset of Market participants. Even though technical analysis theory says Gaps are likely to get filled, Traders should be cautious as the market sentiment is negative. Watch the developing Price action in 4h chart and take trades with proper risk management.


