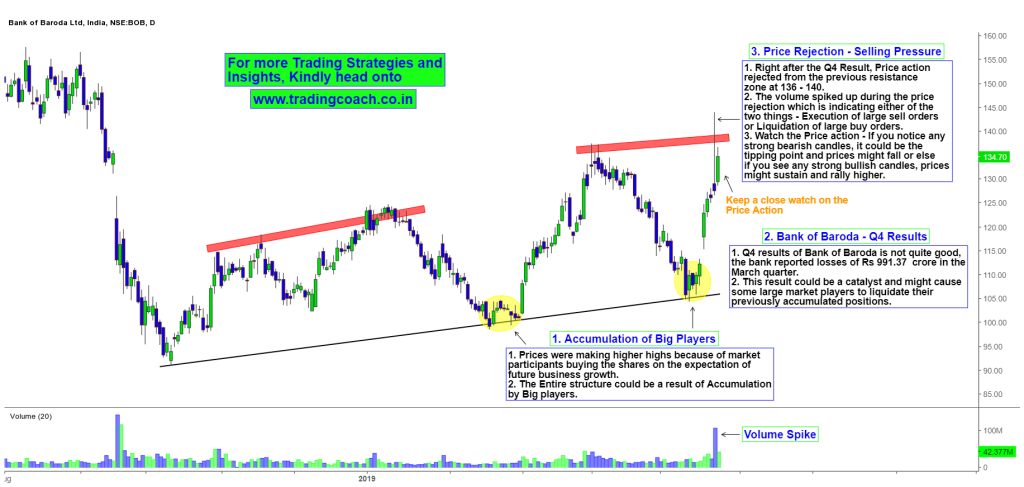
One of the prominent public lenders, Bank of Baroda reported a negative Q4 result. Most of the analysts and pundits were projecting a profitable outcome but the recent report failed to fulfill their expectations. Traders should pay attention to how this disappointing Q4 result might impact the price action of Bank of Baroda shares in upcoming days. To get a better of Idea of what’s going on; take a look at the Price action analysis in Daily chart of Bank of Baroda.
Price Action Analysis in Daily Chart
From September 2018, Share prices were making higher highs although it’s not a strong uptrend. Instead the price behaviour was more or less like an upward moving range. The entire Structure is a result of some big players accumulating shares without moving the prices too much. Most of them could’ve purchased the shares with the expectation of future business growth. But the recent Q4 results have disappointed many of these market participants. The recent negative report might influence some of these large participants to square off their previously accumulated positions.
Right now in the chart, you can notice a price rejection at structural resistance zone 136 – 140 which is an indication of selling pressure. The volume spiked up along with the price rejection, giving us a hint that market sentiment might change. Traders should watch the price action around this structural resistance zone and must take trades accordingly. If you notice any strong bearish candles near by the resistance zone then it could be the tipping point and prices might fall further. On the other hand if you see strong bullish candles and momentum picking up, then prices might sustain and rally higher. Keep an eye on the daily chart; we can expect some significant price movement in upcoming days.

