One of the brilliant quotes in Financial Markets is that “History repeats itself” – neither can you prove this phrase nor you can disprove it. Many times, asset prices have mimicked the Historical price behavior. Repeating Market cycles are visible across all different segments such as Equities, commodities and currencies. We can recognize many historical patterns and seasonal tendencies in stock market. In fact the entire field of Technical Analysis is based on the concept that “Historical price action repeats itself.”
But there are times when Technical predictions have failed badly, Markets didn’t follow any logic, neither had any relevance to Historical price behavior. Despite these pros and cons, it’s still important to analyse Historical price action so that a trader or an Investor can understand different possibilities and scenarios which can probably happen in upcoming future and prepare ahead.
Based on such a thought, here’s the most recent and interesting outlook of Yes Bank Share Prices in the context of Historical Price Action.
Historical Price Action Analysis of Yes Bank in 1 Month Time frame
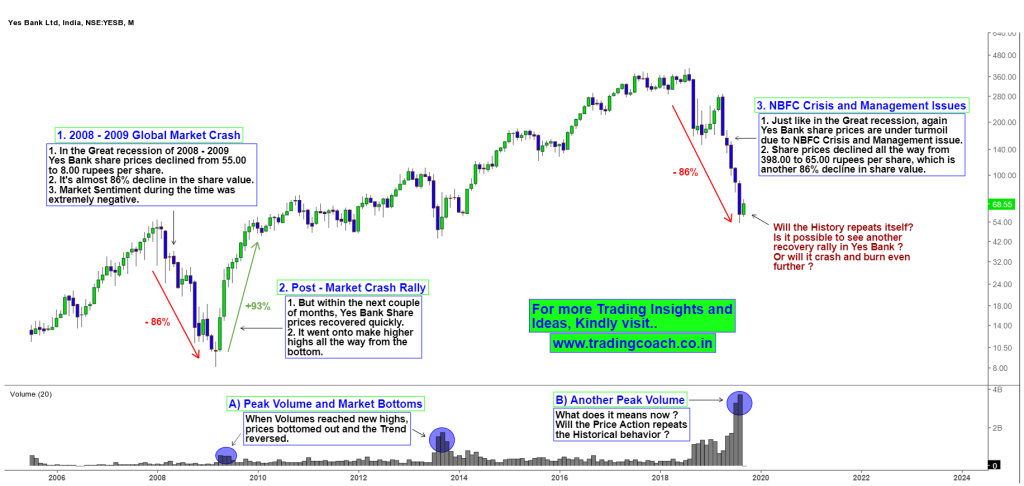
In the wake of great recession and stock market crash in 2008 – 2009, Yes Bank share prices declined from 55.00 to 8.00 rupees per share which is almost 86% decline in the share value. It wiped out nearly 2/3 of the Investors wealth. During the time, all the major media outlets and advisories suggested to exit from the stock. But within the next couple of months after hitting rock bottom, Share prices made higher highs and rallied all the way up to 100.00.
Fast forward to 10 years, today once again Yes Bank share prices are under turmoil because of country-wide NBFC crisis and company’s Inner corporate management issues. Share prices declined from the peak of 398.00 and now trading somewhere close to 65.00 rupees per share, which is another 86% decline in the share value! In terms of valuation it’s trading at very cheaper level. Is this another case for Price action to repeat itself just like in the past?
Well to be honest no one will be able to predict it certainly, (Of course, my job as a trader is to look for opportunities and trading setups, not predictions) but there are some interesting clues we can get from the volume.
When volume reached peak levels in the past, Yes Bank share prices bottomed out and trend reversed from downside to Upside. As you can see the Volume in the price chart, it happened on 2 different instances (marked with blue circles) – First one during 2009, before the market crash recovery rally and the other one during 2013, after emerging market currency crisis. On both the occasions, Stock prices bottomed out and reversed.
Once again, we can see a similar peak volume in the present case. Does it mean the share prices will once again turn around and rally higher? The Price and volume analysis is very convincing except for one thing – The major difference between the past occasions and the present scenario is the corporate management issue. It’s important to note that in the last two major selloffs, Yes Bank didn’t had any fundamental management issues like it’s experiencing now.
So any fundamental news such as corporate changes, restructuring etc. will have a major impact on share prices.
To put it in a proper context, Overall Yes Bank share prices has two different possibilities from here onwards – Historical replay or crash to death scenario. Either it can turn into a major come back or become a biggest flop. If you’re a trader or Investor interested in Yes Bank, Keep an eye on the 1 Month Chart and take decision by watching what happens in upcoming months.

