Paytm stock prices never saw a strong Upside momentum, except in the initial phases after the IPO.
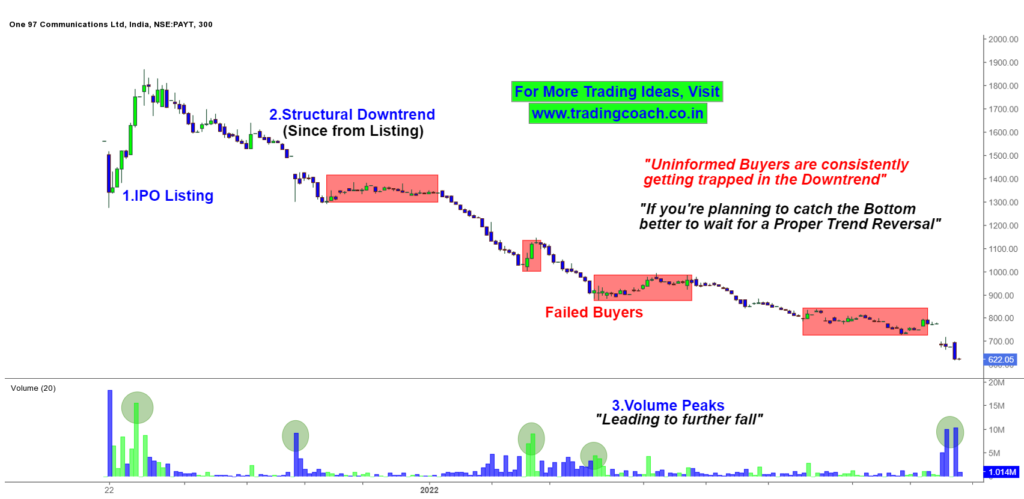
Once the hype was over, Stock Prices continued to tumble all the way from 1900 and currently they’re trading around 625. (At the time of writing this Article)
By looking at the Price Action, we can notice that many Uninformed Buyers tried to catch the bottom of the Stock, only to fail miserably and get trapped in the aggressive Downtrend.
The Chart clearly shows the aggressive Downtrend in Paytm Shares. Take a Look !
Paytm Shares – Price Action Trading Analysis on 5H Chart

We can see that many times Buyers fail to push prices higher. See those red-colored boxes on the chart. Those are all indications of Failed Buyers.
Another interesting Behavior is, every time Volume peaks, it leads to a further Selloff in stock prices. Maybe it could be a sign of some Big Players exiting the Stocks.
If you’re planning to catch the Bottom, better to wait and look forward for a proper trend reversal on the stock.
Keep an eye on the Price Action and be careful if you’re planning to buy the stock. As of now, we are not seeing any strong Buying Pressure on the stocks.
Technically, it’s better to take a decision once we see a good Upside Momentum along with increasing volume. Until then, it’s a watching game. Checkout my video to learn more about trading trend reversals.


