Trading volume is one of the most widely used tools by Professional traders. It tells us about the total number of shares traded for a given period of time. Many people think trading volume is just another indicator, but it’s not! It is actually a representation of Market Sentiment.
How Trading Volume is calculated?
Let’s assume that market consists of two traders. Say, the first trader purchases 500 shares of QWE and the second trader sells 250 shares of QWE. Then, the total trading volume will be presented as 750, which means 750 shares have changed hands.
If the trading volume of a stock is given as 24 million, it means 24 million shares have changed hands.
How Professional traders use the trading volume?
Professional Traders use the trading volume to:
1. Confirm the Price Momentum
2. Identify the Trend reversal
3. Know the Liquidity of a Stock
1. Using Volume to Confirm the Price Momentum
Simply put, momentum is the speed at which the return of a particular stock is changing. Traders closely monitor the price momentum to buy and sell the stocks. Such type of trading is also known as “Momentum Trading”.
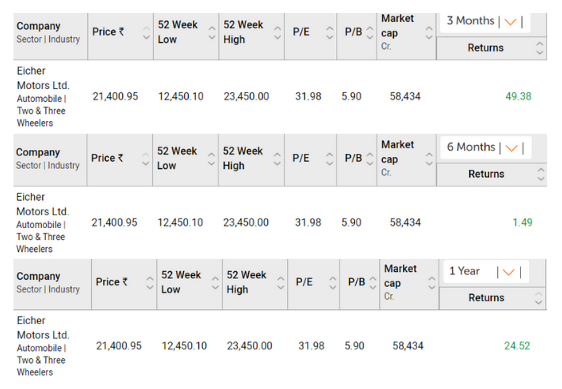
Usually, Traders buy the stock when they see a potential increase in its return over the last 3months, 6months and 1 year and sell it when they notice a potential decrease in its return over the last 3months, 6months and 1 year.
Professional Traders use the trading volume to confirm the Momentum of a stock
Say, the price of the stock, QWE has increased by 10% over the last 1 yr, 8% over the last 6 months and 5% over the last 3 months; it is a clear indication of bullish momentum.
Price Momentum of Eicher Motors
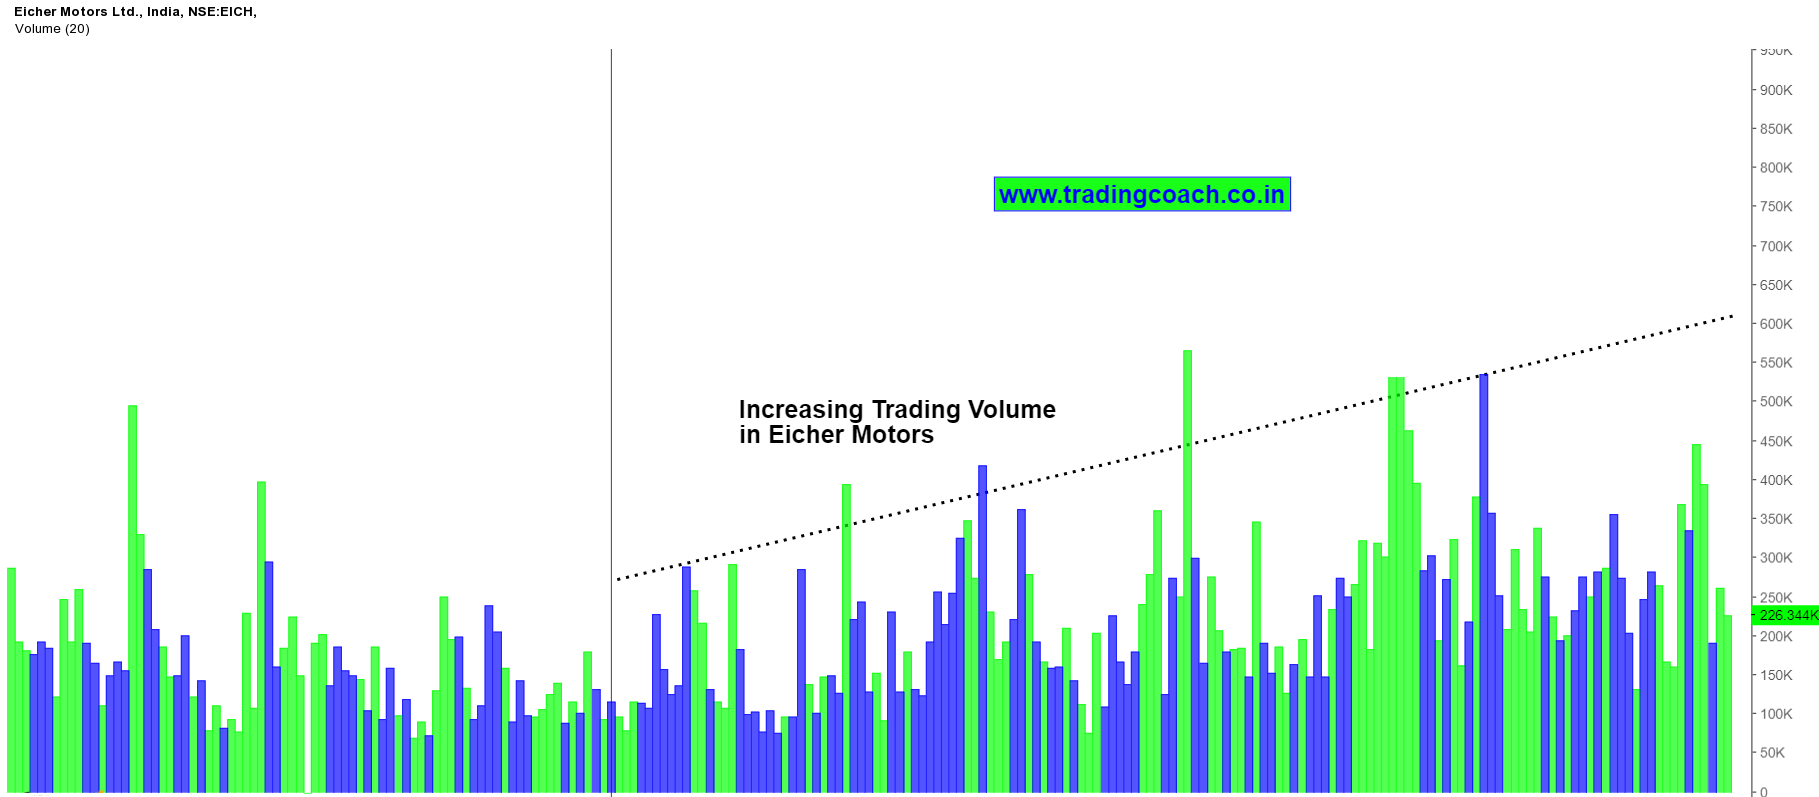
But, before buying the stock, it’s better to look at the trading volume to confirm the momentum.
Even if the stock is showing positive returns but the volume is declining, then the chances of stock prices increasing is very less. On the other hand if the volume is rising, the stock prices can rise further.
Volume Supporting the Price Momentum of Eicher Motors
Likewise, If QWE has decreased by -10% over the last 1 yr, -8% over the last 6 months and -5% over the last 3 months, It is a clear indication of bearish momentum.
But, before selling the stock, it is better to look at the trading volume to confirm the momentum.
Even though the stock is showing negative returns but the volume is declining, then the chances of stock prices decreasing is very less. On the other hand if the volume is rising, stock prices can fall further.
2. Using Volume to Identify Trend Reversals
Trend reversal occurs when the trend changes the direction from upside to downside or Downside to upside. By using trading volume, we can spot these trend reversals beforehand.
Say, QWE stock prices are in an uptrend for 5 months, before buying the stock, an informed trader should look at the trading volume.
If the trading volume is decreasing, it’s indicating that the bullish uptrend in QWE is losing strength. There’s a good chance, share prices of QWE will decrease. Hence, the existing trend could reverse.
Decreasing Volume in an Uptrend Indicates Possible Trend Reversal
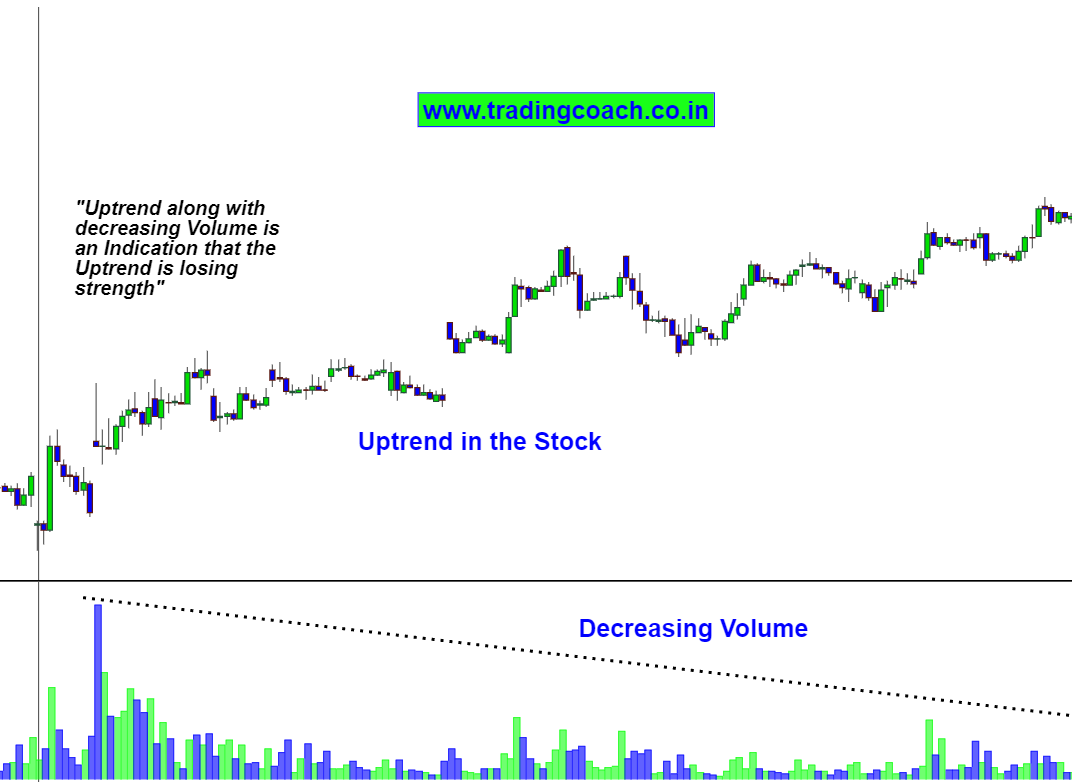
On the other hand, if the trading volume is increasing, it’s an indication of bullish uptrend in QWE gaining strength. There’s a good chance that existing trend could continue.
Same can be said in terms of Downtrend. Say, QWE stock is in a downtrend for 5 months. Before buying the stock, an informed trader should look at the trading volume.
If the trading volume is decreasing, it’s indicating that the bearish downtrend in QWE is losing strength. There’s a good chance, share prices of QWE will increase. Hence, the existing trend could reverse.
Decreasing Volume in a Downtrend Indicates Possible Trend Reversal
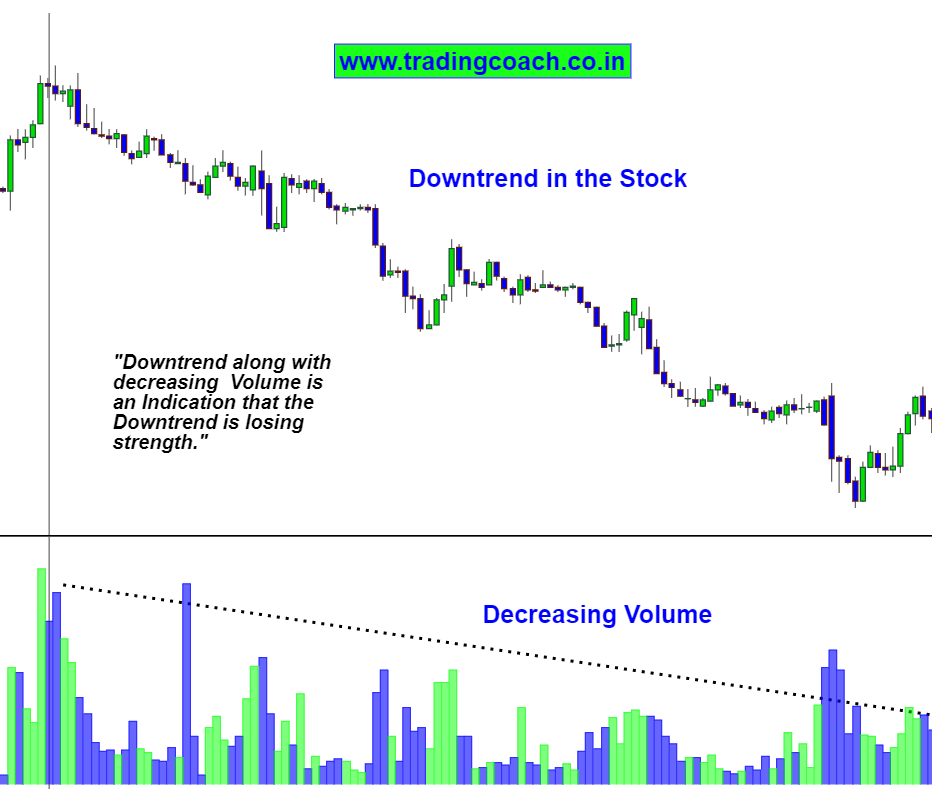
On the other hand, if the trading volume is increasing, it’s an indication of bearish downtrend in QWE gaining strength. There’s a good chance that existing trend could continue.
3. Using Volume to Know the Liquidity of a Stock
Liquidity is actually interrelated to Volume. As a matter of fact, trading volume is a good indicator of a stock’s liquidity.
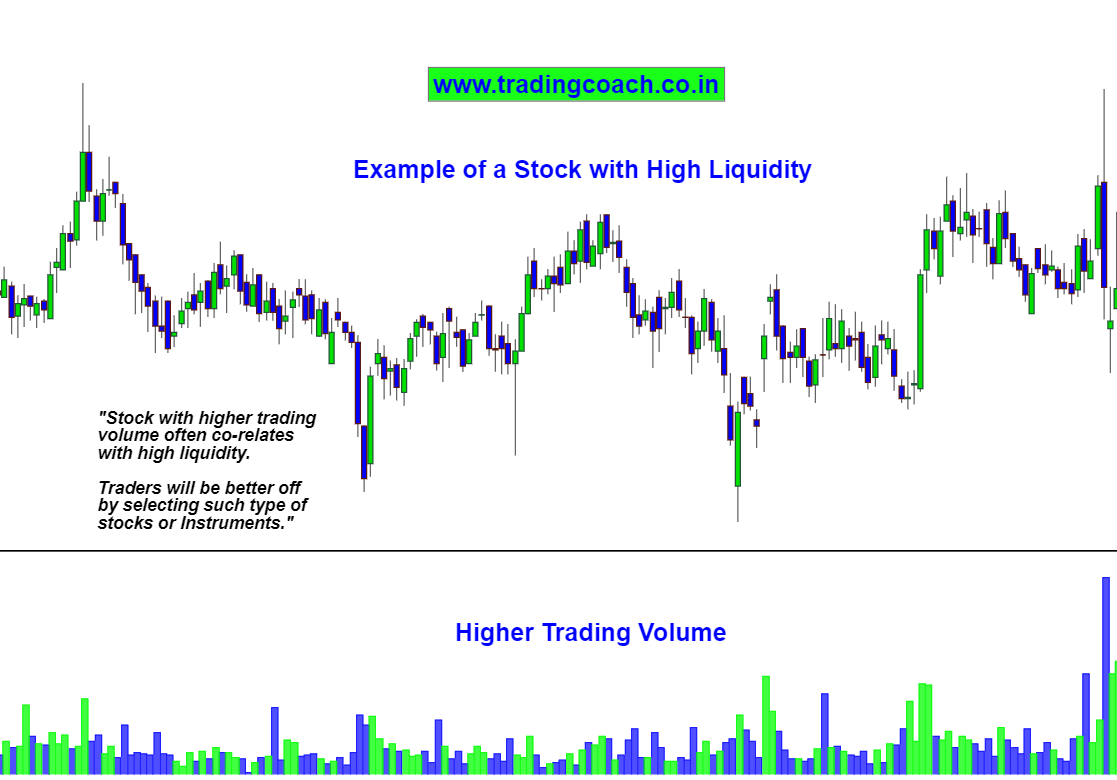
If the trading volume of a particular stock is high, then by definition, the trading activity is high in that stock. Higher trading activity means more Liquidity in the stock.
Stock with High Liquidity
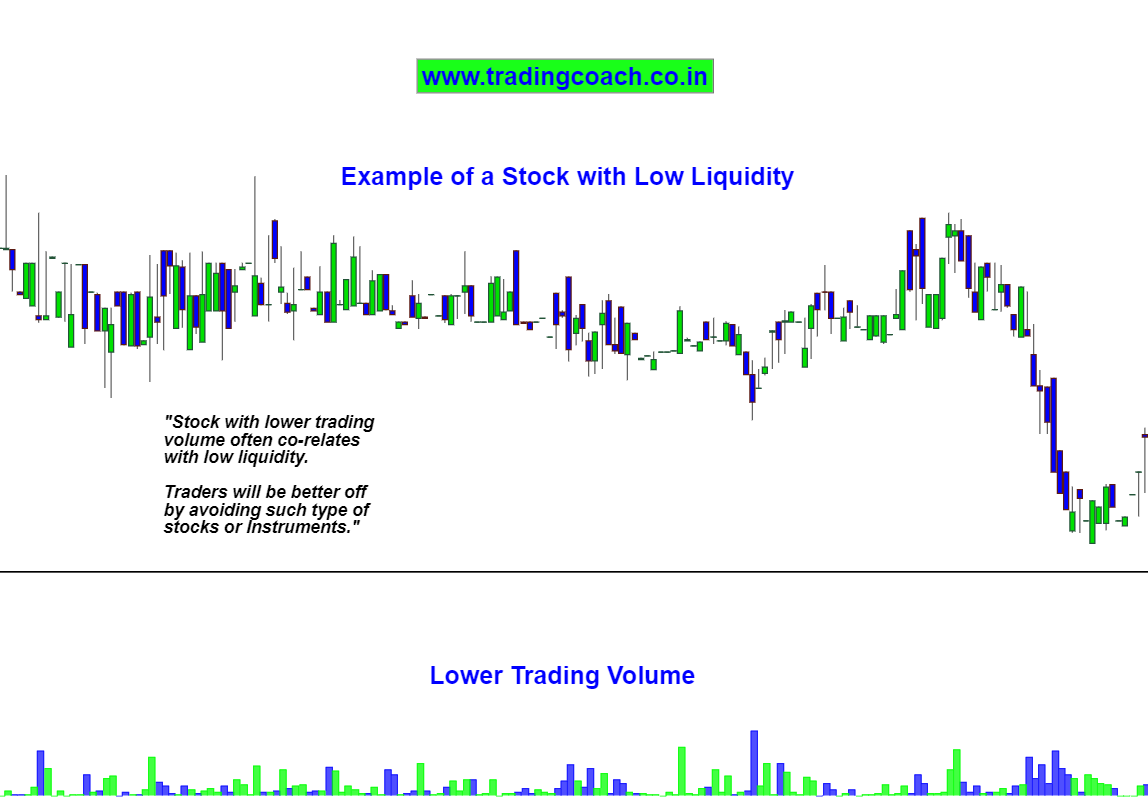
If the trading volume of a particular stock is low, then by definition, the trading activity is low in that stock. Lower trading activity means less Liquidity in the stock.
Stock with Low Liquidity
Conclusion
Trading Volume is not just another Indicator; it’s an excellent tool which represents the Market Sentiment.
A sharp increase in trading volume indicates that the stock is gaining momentum, whereas a sharp decrease in trading volume indicates that the stock is losing momentum.
Comparing Trading volume and trend of the stock will be helpful to anticipate trend reversals.
If the trading volume of a particular stock is high, the liquidity will be high, and if the trading volume of a particular stock is low, the liquidity will be low.
By combining volume along with Price Action Strategies, one can find an excellent edge in Trading.