Axis Bank Share Prices are seeing some renewed buying interest from last couple of days.
When we look at the Market Structure, we can notice that Stock Prices are moving in an Upward Range or Upward Channel. The Structure has changed from Trend to Upward Range, in the beginning of 2021.
Take a Look at the Price Action Analysis on 1W Chart…
Axis Bank – Intermediate Trend and Price Action on Weekly Chart
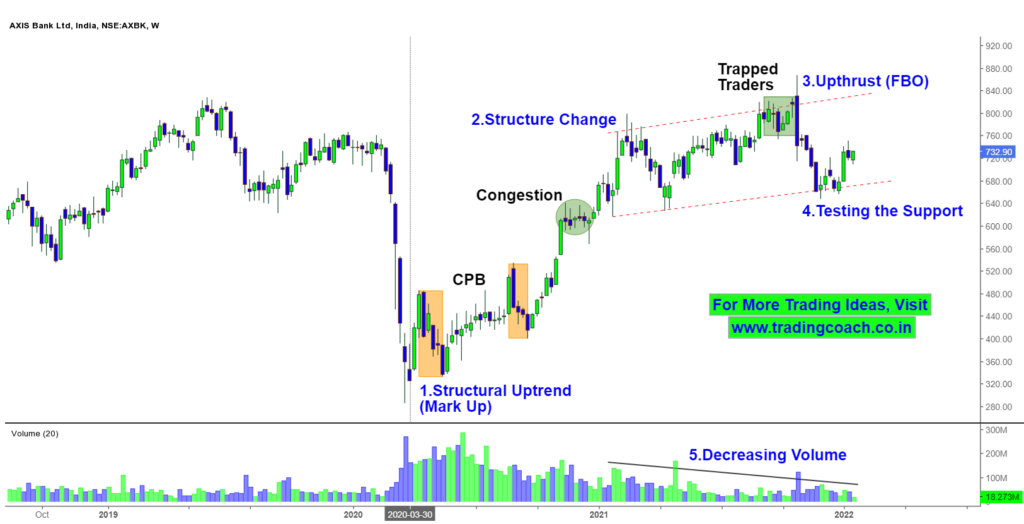
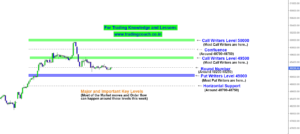
The Parallel Support zone is around 680 and Parallel Resistance zone is around 850. So far, Prices are moving between them.
Right Now, Prices are testing the Support Zone. We can clearly witness that Price Action on the Chart. If buyers are strong enough, then we might see a good increase in the stock prices. On the other hand, If Prices break below the Support Zone, it can show the strength of the Sellers and Prices could fall lower as a result.
Volume is decreasing since from the beginning of 2021, it’s a sign of concern. The Volume indicates that order flow and trading activity is very less on the stock.
In my perspective, I would better focus on trading the Axis Bank only when prices touch or test the Parallel Support or Resistance Zone. It’s better to avoid trading in the Middle as traps are very common in Volatile stocks like Axis Bank.
Traders should keep an eye on the Price Action and Volume Behavior on 1W Chart and take decisions accordingly.