Bank Nifty’s recent Market Behavior and Volatility is extremely confusing for most of the traders and Investors. Lower time frame Price Action is filled with noisy fluctuations, Traps and Price Gaps.
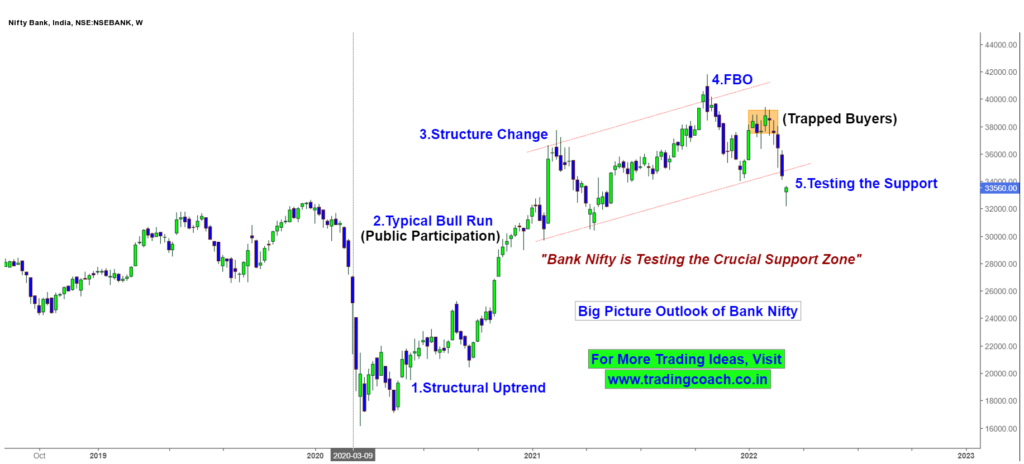
To Get a Better Clarity of the Price Action, Let’s take a look at the Big Picture on 1W chart of Bank Nifty.
Bank Nifty Price Action Trading Analysis on 1W Chart

Market Structure has changed from a trend to a Parallel Channel. Most of the Buyers and uninformed traders who were trapped in the Price Action were forced to liquidate their positions.
Right Now, Prices are testing the Crucial Support Zone at 34000 – 33500. If we see further selling pressure in Bank Nifty, Prices are likely to go even lower till 33000.
In case of a Strong bounce back, Price Action is likely to test the Resistance Zone at 36500.
Traders should keep an eye on the Price Action and take positions accordingly with strict risk management.


