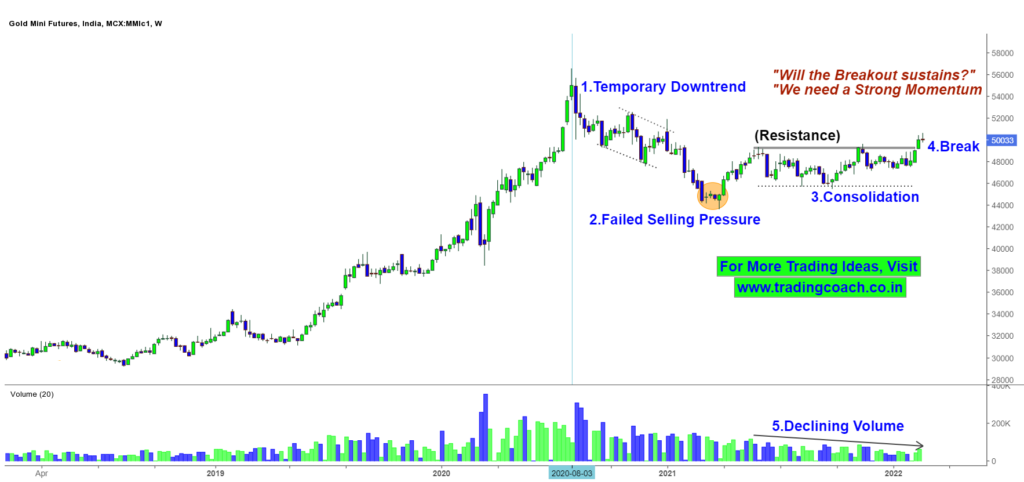
Gold prices were out of the spotlight for several months, and it didn’t receive much interest from the investor community. Price Action was struck in a boring tight consolidation of 49500 – 48500 in the MCX market.
Even as of now, prices have not yet clearly crossed the boundary. The Potential Resistance zone is at 49500 and Support zone is at 48500.
But recently there’s some hope for Gold Prices, as Price action tested Resistance and broke out mildly from the resistance. Is it time for Gold Prices to shine once again?
Take a look at the Price Action Analysis on the 1W Chart to find out…
Gold Price Action Trading on 1W Chart

We can notice the recent break above the Resistance Zone at 49500. But however, we don’t see any force or momentum behind the Breakout.
In order for the Breakout to be successful, we need to see a strong momentum towards the upside. Failure to see any follow-through momentum can turn the Price Action into another False Breakout
Also, we don’t have any significant volume supporting the Price Action. The Volume is consistently declining from mid-2021.
If the Breakout is successful, we might see a nice upside trend in Gold prices. Failure of a Breakout can push prices back into the Range.
Traders should watch the Price Action near the Resistance Zone. Based on Momentum and Market Behavior, take your decisions accordingly.


