After going through numerous problems, management issues, reshuffles and corporate crunches, IDFC First Bank is once again making headlines.
Ticker symbol, NSE: IDFCFIRSTB has gained by more than 100% within the last 6 months. Stock prices have shot up from 30 to 60 within the time period from June to Dec.
There’s a nice structural uptrend in the stock. Take a look at the Price Action on the 1D Chart.
IDFC First Bank – Price Action Analysis on 1D Timeframe
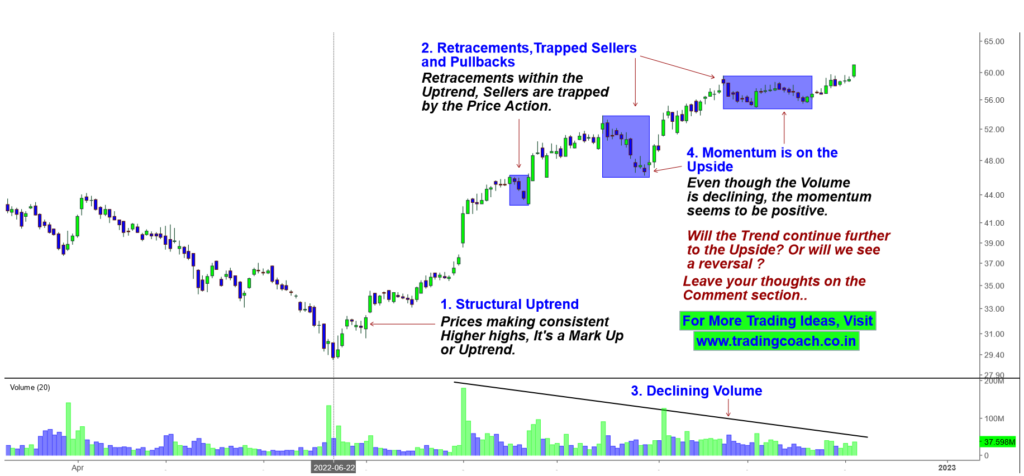
We can notice an excellent uptrend since the beginning of June 2022 and prices are consistently making higher highs.
The Uptrend resembles much of the classic Wyckoff Markup phase, as there are retracements within the uptrend; sellers are trapped by the Price Action.
The most important part in this analysis is the Volume. Observe how the volume has been declining since the beginning of August 2022. This is a bad sign for the Uptrend and buyers.
Even though Volume is declining, momentum is still positive on the stock and favors an upside outlook.
Will the trend continue further to the upside or will we see a reversal in the stock? What’s your opinion? Leave your thoughts in the comment box.
To learn more about the Volume analysis and trading strategies, checkout the video given below.