Many are confused by the recent price action of Nifty 50. Index prices are trading around the Support zone at 17200.
Volatility is dominating the market behavior and traders who have taken positions around the Support zone are trapped by the erratic fluctuations.
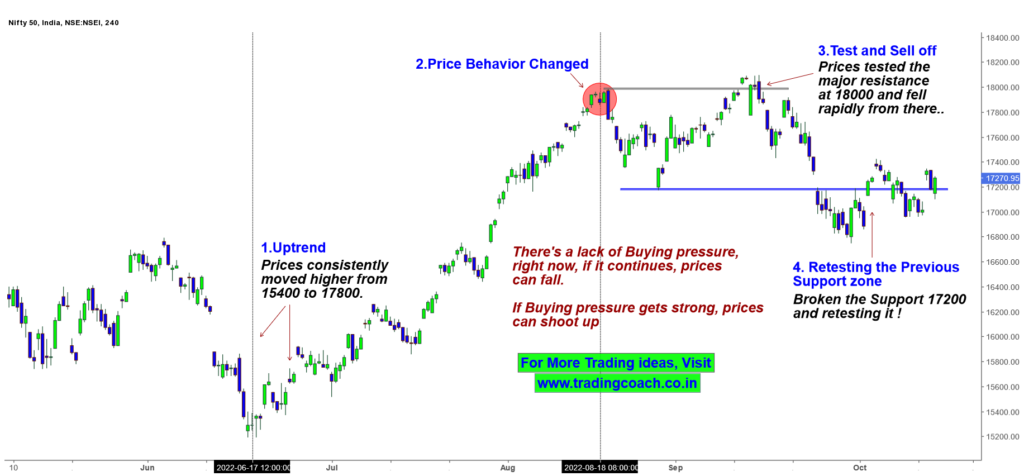
Take a look at the Price Action Analysis on the 5H Chart
Nifty 50 – Price Action Trading Analysis on 5H Timeframe

After testing the major resistance at 18000, prices fell rapidly from peak levels. Bearish sentiment took control of the market prices.
Recently, prices broke the major support zone at 17200 and are right now retesting it. During the retest, many participants who have taken positions are trapped by the market behavior.
As price action is dancing around the support, volatility continues to increase in the Index.
To learn about trading the support and resistance zone in Volatile market, checkout the Video on trading strategy given below in the end.
There’s a lack of Buying pressure on the prices right now. If it continues, prices could fall further. On the other hand, if buying pressure gets strong, market prices can shoot up.
I am taking a slight bearish stance on the Nifty. What is your take on Nifty 50? Let me know in the comment section below.


