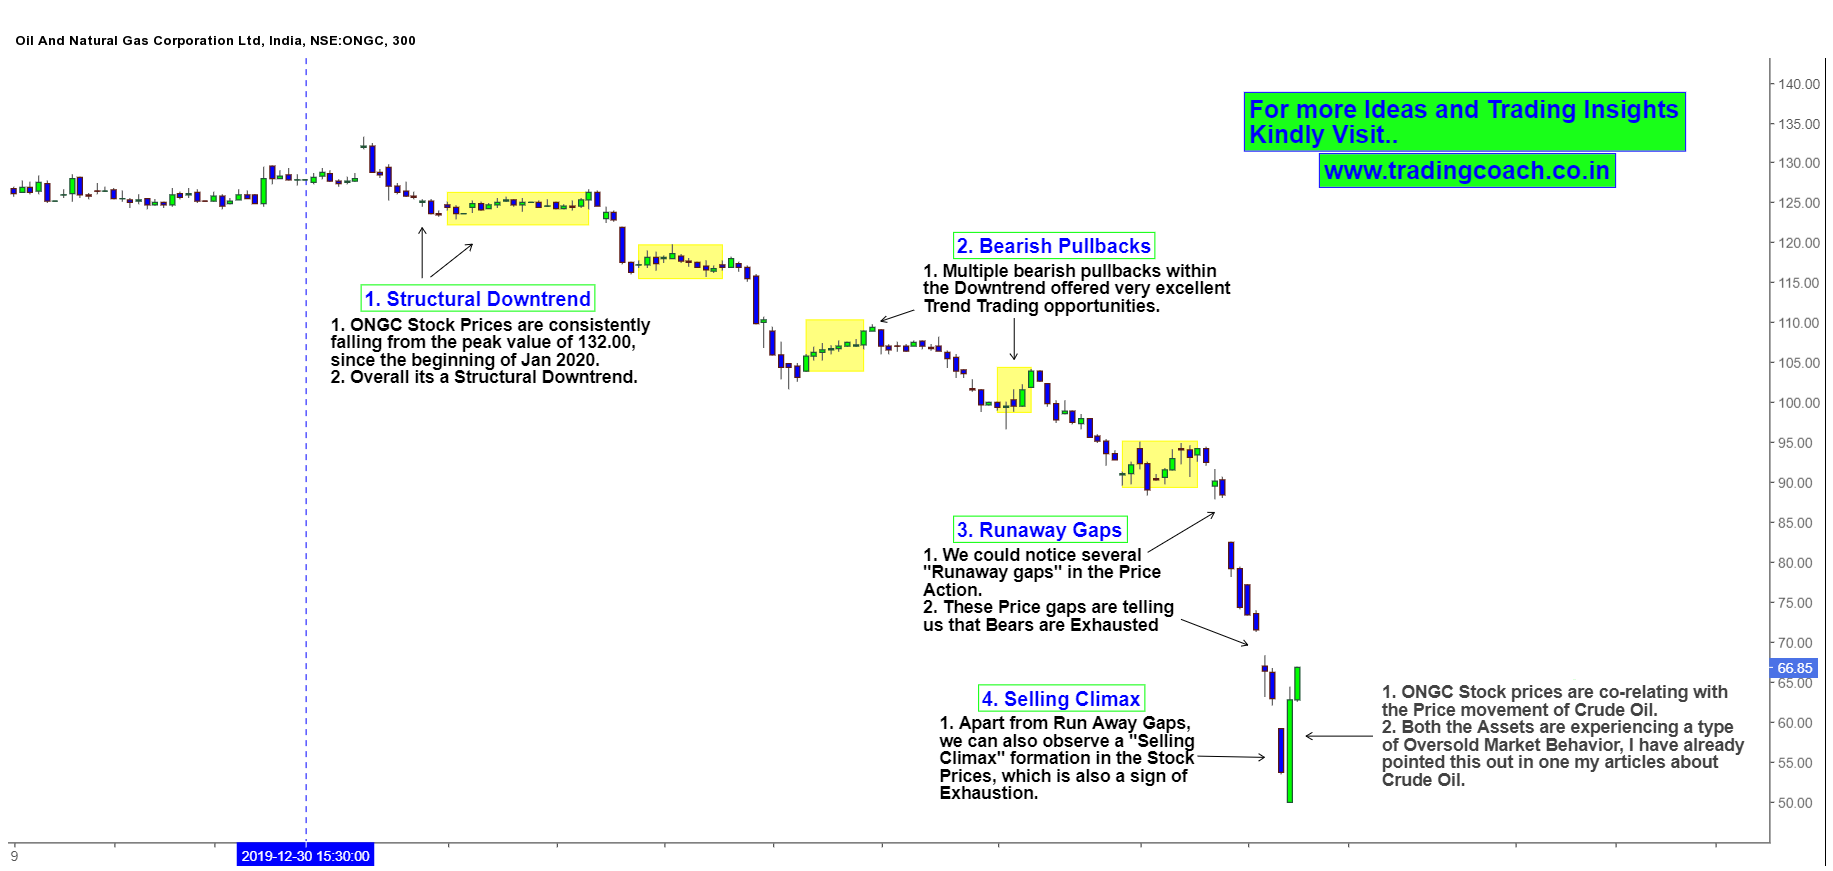
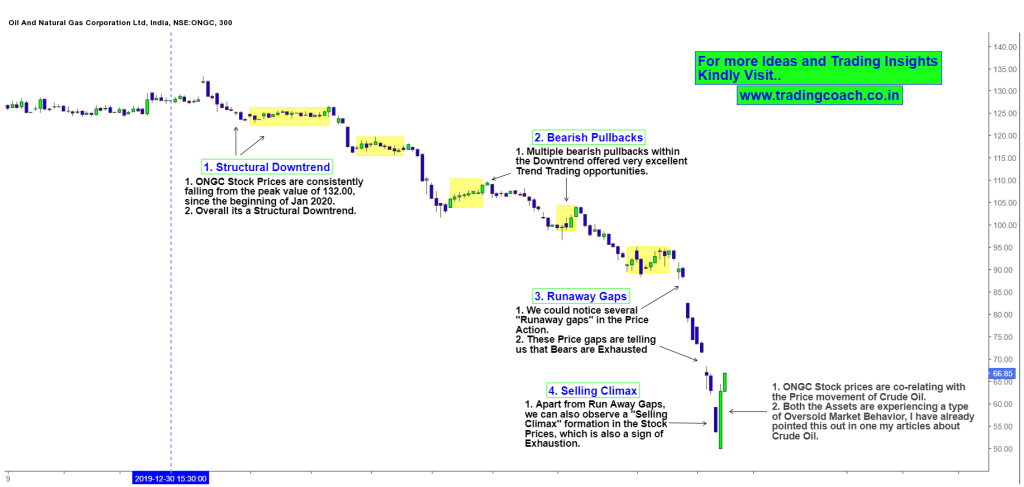
It’s obvious to see that markets are pretty volatile from last few days. But despite the high Volatility, There are some Interesting Price Action Setups and Trading opportunities taking place in multiple stocks. Oil and Natural Gas Corporation is one of those stocks in which we can spot a selling climax formation. I have already written about Climax patterns extensively in previous articles. Take a look at this 1D Chart of ONGC, to see the structure of the Pattern.
Oil and Natural Gas Corporation – Price Action Analysis

Stock Prices are in Structural Downtrend since the beginning of Jan. Shares have fallen from the peak value of 132.00 to all the way down till 50.00 and now trading around 65.00. Within the Downtrend, we could witness multiple bearish pullbacks which were an excellent trend trading opportunity for Short sellers. From the March first week onwards, Price Action structure started to change.
We could notice Runaway gaps and Selling climax formation in the Stock prices, which is precisely a sign of Market Exhaustion. There are good possibilities of a rebound in ONGC and it’s already beginning to show some positive signs. But another important fact is – stock prices are also co-related with the price movements of Crude Oil. So any further impact on Crude oil can affect the Share prices.
We can expect a rebound in ONGC share prices, but a further fall in Crude Oil could be a negative catalyst for the stock. Traders should trade the Price Action of ONGC and must watch the Crude Oil market sentiment.
