Crude oil prices might be trading at an inflection point. Even though it looks like a Bullish Market overall, the Price Action tells us a different story.
We can see some signs of Structural changes and prices retracing sharply after testing the highs at 10000.
What’s more important is that buyers who bought at the peak levels (most likely to be uninformed traders) are trapped in market positions.
Take a look at the Price Action Outlook on the 1D Chart.
Crude Oil Price Action Analysis on 1D Chart
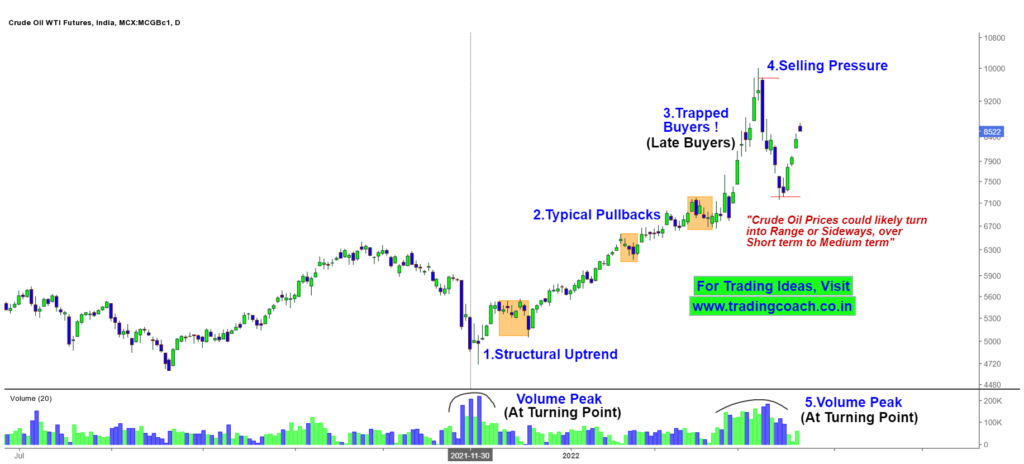
Late Buyers who ended up taking positions at the peak levels are trapped in the market. They’re likely to liquidate their positions at unfavorable prices.
We can clearly notice the Selling Pressure in Price Action after Crude Oil tested the peak level at 10000.
The Potential Resistance Zone is at 10000 and the Potential Support Zone is around 7250. Apart from that, Volume has peaked out, which is a possible indication of a turning point.
A further rally in Crude oil prices is less likely to happen, besides the fact it’s also not good for the economy. The market could turn into a Range or Sideways, over short term to medium term.
Traders, Keep an eye on the Price Action on 1D chart. Prepare to take positions as per the market sentiment.