In the year 2017 auto stocks managed to outpace the benchmark equity index. In the past year, Sensex gained 28 percent whereas BSE Auto index soared 32 percent. First time since 2013, car and SUV sales surpassed 3 million in 2017, despite the GST rollout and demonetization turbulence. According to the initial estimates, there was 9.2 percent growth in the sale of passenger vehicles. From 2.9 million units in 2016 the personal vehicle sale reached to 3.2 million and the final figures are a positive indication for the sector growth.
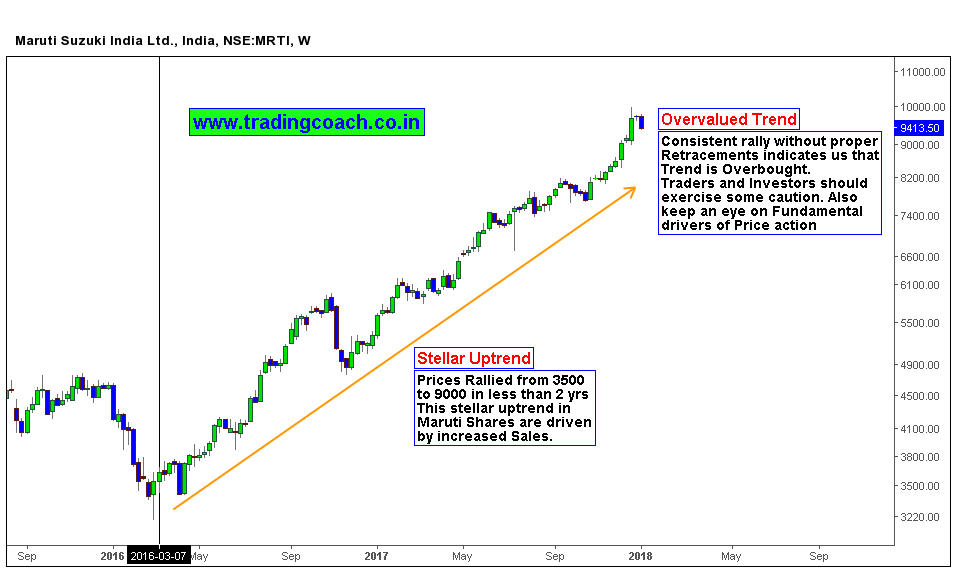
Maruti Suzuki Share Prices in Weekly Chart
Stocks of India’s biggest car maker Maruti Suzuki soared 82.81 percent. On December 2016, shares were trading at Rs 5,323 and now they have reached to Rs 9,700. This Monday Maruti reported a 10.3 percent jump in December sales which reached to 130,066 units but in December 2016 only 117,908 units were sold. Looks like Domestic Institutions were betting highly in 2017 on Maruti due to this factor.
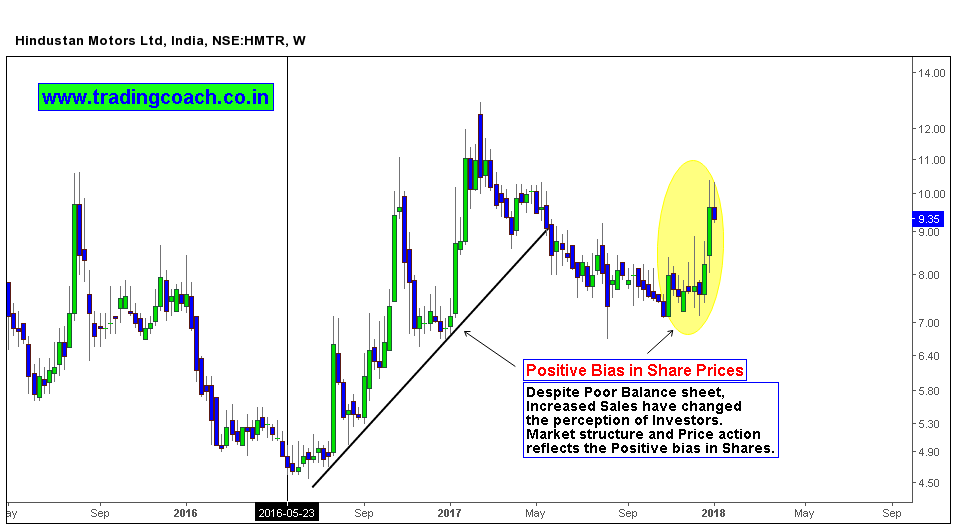
Hindustan Motors Share prices in Weekly Chart
In the last 12 months, other auto majors including M&M gained 27 percent; But Tata Motors slipped 9 percent in the same period. On this Monday it was reported by M&M that its total sales including exports for the Month of December rose by 8 percent. M&M sold 36,464 units in December 2016 which increased to 39,200 units at the end of 2017. During the same period, there was a 40 percent jump in Hindustan Motors from Rs 6.91 to Rs 9.64. It is also a fact that demand growth was supported by favorable monsoons in 2017.
Looking at the Price Action of these stocks in Daily chart, we can see that Uptrend is quite stretched and trading in overbought conditions. Trader and Investors should exercise a Little caution in the short term. Long-term performance of these stocks depends on sales growth and economic consumption. There is no denying the fact that Indian auto stocks were really brought high because of the huge sales of cars and SUV’S in 2017. So keep an eye on the sector and stocks for trading opportunity.


