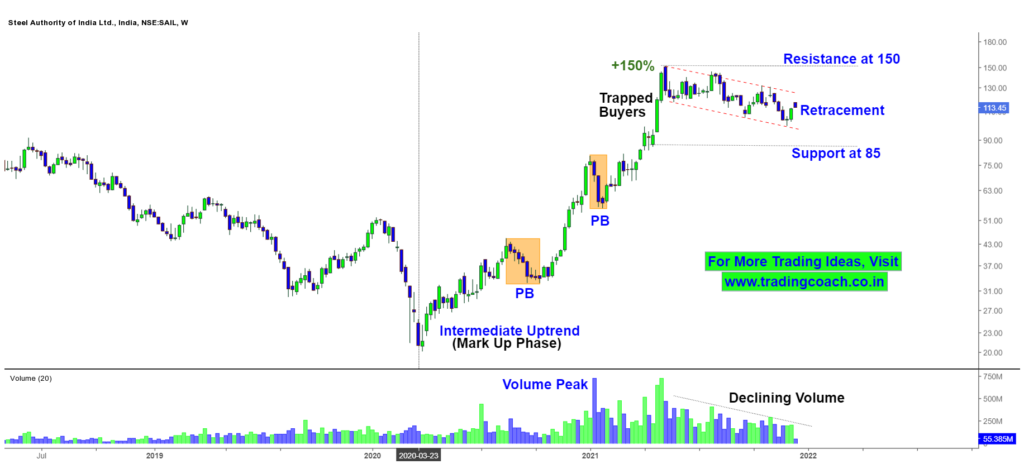
Steel Authority of India Ltd, NSE: SAIL Stock Prices are retracing from the Year Long Uptrend.
Since from March 2020, the SAIL Stock prices rallied all the way from 20 to 150 per share, making a net total gain of +150%.
As of now, Prices are retracing from the peak of 150 which also happens to be a Potential Resistance Zone. The Intermediate Uptrend, which we can clearly notice on the Weekly Chart, is getting tested.
Take a Look at the Price Action Analysis of SAIL in Weekly Chart
SAIL Stock Prices on Weekly Chart

The late Buyers who got into the Positions during period of April – May 2021 are now trapped in the Market.
Along with the Retracement, we can also notice a Declining Volume in the Stock Prices, which is an Indication of less order flow or trading activity taking place on the Stock. The Potential Resistance zone is at 150 and Support zone is around 85, as per the weekly chart.
Based on the Observations we can say that the Uptrend in SAIL is likely to change either into Sideways or into a Short term correction, if Selling Pressure continues further.
In order for the Stock Prices to go up, we need to see a clear Breakout at the Resistance at 150 and a proper Retest around the Zone.
Traders should keep an eye on the Price Action in Weekly Chart and take decisions accordingly.
