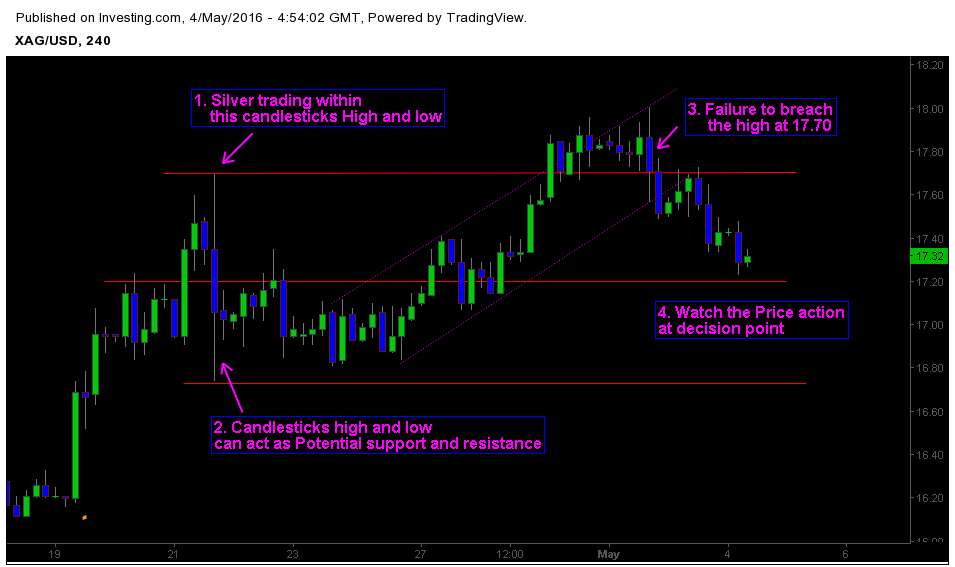
Precious metals are outperforming other assets so far. Silver’s price action is following investor sentiment and global economic concerns. Given the high momentum in Gold and Silver, analysis on the data of Silver leads to a conclusion like gold. Currently price action is testing the decision point at 17.20 zone after a massive selloff. Traders should keep their focus on minor key levels at lower time frame.
Below is the 4h chart of Silver with price action analysis of spot market.

1. Silver is trading within the previous candlestick’s high and low
Market’s volatility diminishes at turning points and increases when investors are uncertain. Precious metals are after the similar route. As you can see the chart, Price action is trading within the high and low of bearish candlestick which formed during mid April. It’s a potential sign of high volatility presence in market structure.
2. Candlestick’s high and low acting as potential support and resistance
Bearish candlestick’s high at 17.70 and low at 16.74 is containing the price action within the specific range. In other words the high and low of candlestick is acting like potential support and resistance. This means that both buyers and sellers are defending both sides at key levels.
3. Price action failed to breach the high at 17.70
Market tested the key level at 17.70 that resulted in a failure to break above it. Price movements like these usually trap weak hand players and shake them out of market structure. The resulted formation is technically a price action pattern known as Breakout Failure. In the perspective of Lower time frame, it’s an end of a channel formation.
4. Watch the price action at decision point for potential trading opportunities.
Price action is now testing the decision point zone at 17.20. Traders should check the price behavior at decision point and keep an eye on respective price levels. Short term traders can look for opportunities at lower time frame to trade along the market sentiment.


