Tata Motors Share prices have climbed around 11% within a week. Is it a Beginning of a New Trend? What’s next for Tata Motors? For Answers, we need to look at the Price Action of Tata Motors on 1D Chart.
Take a Look at the Price Action Analysis on 1D Chart
Tata Motors Share Prices on 1D Chart
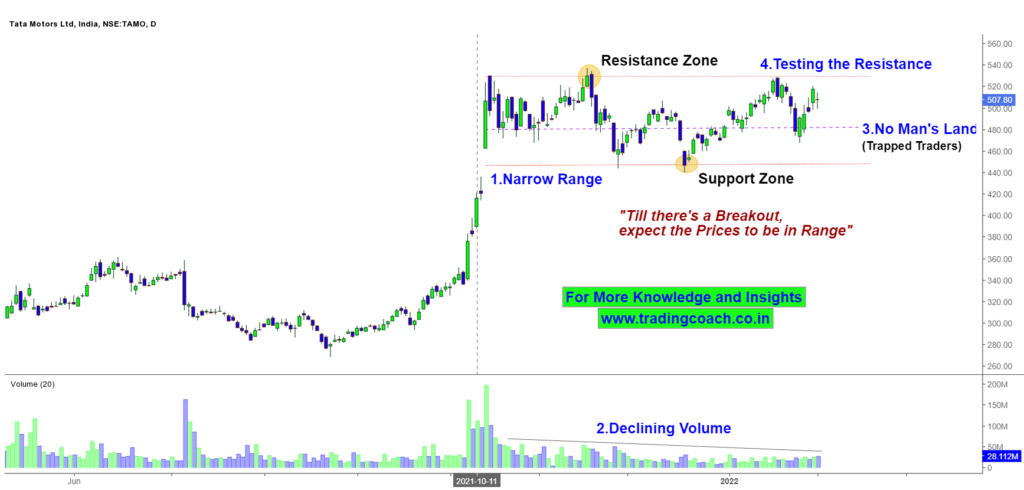
When we look at the Market Behavior, we can understand that Prices are trading in a Narrow Range Structure. Volume is consistently declining since from the beginning of the Range, which indicates that less trading activity is taking place on the Stock.
Beware of the No Man’s Land, avoid taking positions around 480 as most of the traders are trapped within this area. Price Action is likely to be random and unpredictable around the area. It’s better to focus our trading at Support and Resistance Zones within the Narrow Range.
Respective Support Zone is around 450 and Resistance Zone is around 530
Right now, Prices are testing the Resistance Zone. Until we see a clear Breakout either at Support or Resistance, prices are likely to be struck within a Range.
Traders should keep an eye on the Price Action and Volume Behavior in 1D Timeframe and take decisions according to Market Sentiment.