Chemical stocks are something that I avoid very often due to their volatile nature. Volatility is good for range trading, but it’s not suitable for trending markets. Since the entire Stock market is in mean reversion and giving us very few opportunities to utilize, it’s better not to neglect any setups we get!
TATA CHEMICAL SHARE PRICES IN DAILY CHART
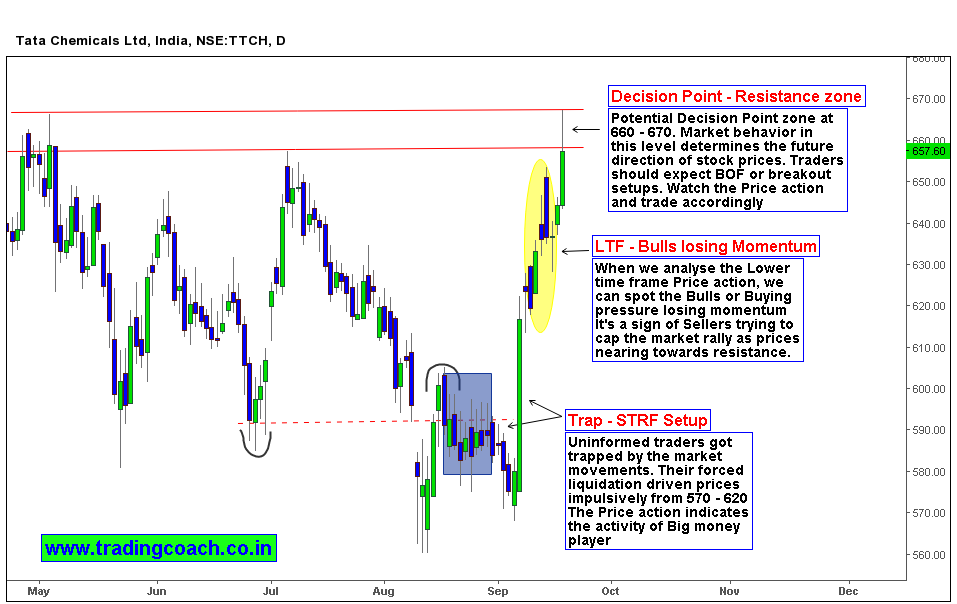
Tata chemicals LTD (NSE: TTCH) I am observing the stock Prices from past few days, it can give some potential range trading setups for Swing and Positional Traders. (If you’re a follower of my articles and updates, you already know that I am only capturing range trading opportunities from last 2 months due to current market context)
In Tata chemicals Daily chart, we can notice the Prices trading at 660 – 670, a potential decision point – resistance zone; we can expect a key setup formation in the zone. In lower time frame such as 1h, 4h, price action reflects the bullish momentum slowing down. Market behavior at Resistance zone 660-670 can give an insight about future direction of stock prices. We may get a BOF or else a Breakout opportunity in the zone. Watch the Price action and Trade accordingly. Remember that market volatility is very high, so make sure to have proper risk management plan.