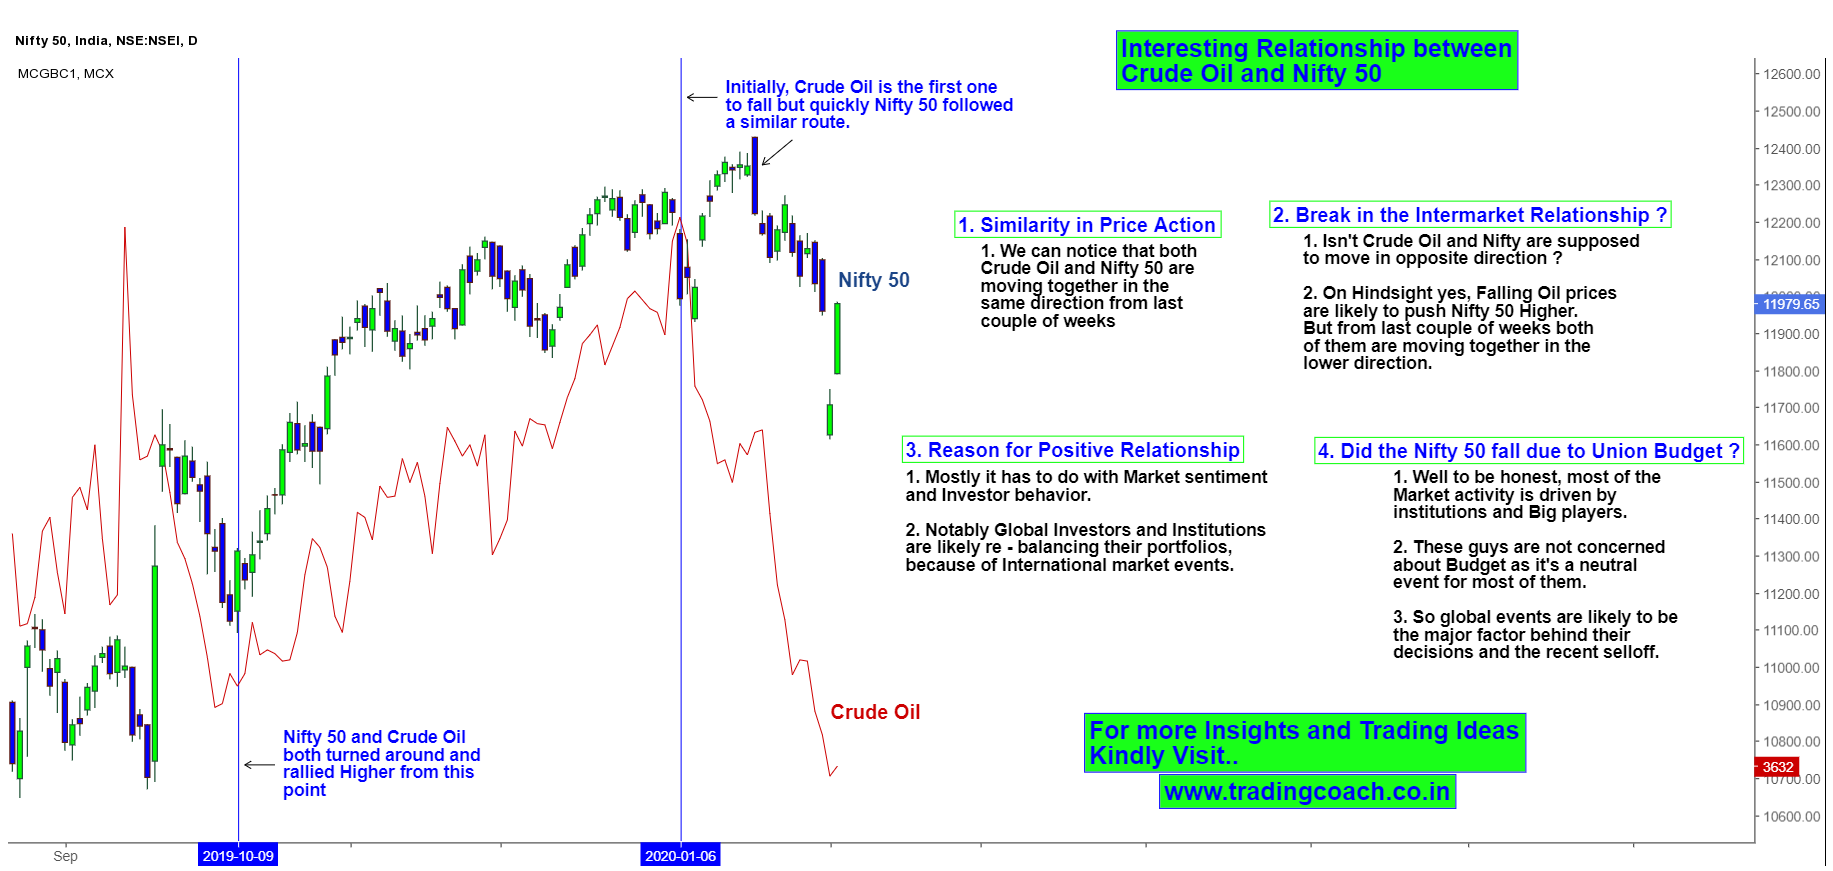
Here’s an interesting chart that all traders should focus on – Intermarket relationship chart of Nifty 50 and Crude Oil. From last couple of weeks both Nifty 50 Index and Crude Oil prices are moving together in a similar direction. Factually speaking, falling oil prices should push the Nifty higher and rising oil prices should push the Nifty lower. But what we are witnessing on this chart is completely different.
Intermarket Relationship between Nifty 50 and Crude Oil
The similarity between Crude Oil and Nifty 50 is going on since October 2019. Take a look at the turning points, both the assets turned around and rallied higher from October 10 2019 onwards. Eventually on Jan 6th, Crude Oil experienced a sharp fall in its price value; quickly Nifty also followed a similar route and declined drastically from the top. It’s very obvious to notice both the assets experiencing a positive co-relation.
What’s the Reason for this Positive Relationship?
Both Nifty 50 and Crude oil is supposed to have a Negative co – relation. So why are we experiencing a sudden change in the Market relationship? Well to be honest, most of the market behavior is driven by High scale financial institutions and big players. It seems like they’re re-balancing or re-positioning their portfolios because of International market events and what they perceive ahead of them – namely “Inflation risk”.
Yep you heard it right! It looks like most of the big players are expecting inflation to shoot up in coming months.
Only in Inflationary environment both Commodities and Stock prices trend together in a similar direction. So it won’t be a surprise if all asset prices continue to increase in future. Trading wise, we can expect some good Price Action setups to show up on both Crude Oil and Nifty 50 in coming days.

