

The basic premise of Intermarket analysis is that all markets are related. In other words, what happens in one market has an effect on another. On a macro level, the four interrelated markets are the commodity, currency, bond, and stock markets. Institutional traders have long understood the impact of interest rates on stocks, for example. Rising interest rates have historically been bad for stocks, especially those in interest rate-sensitive market sectors.
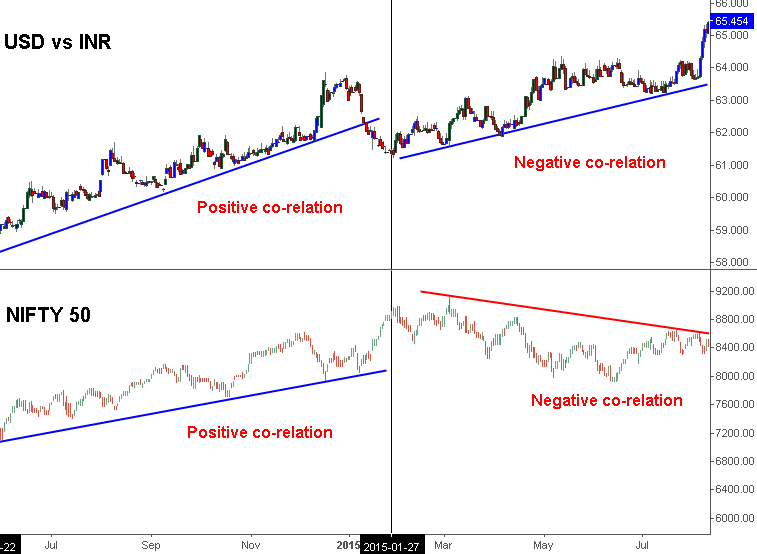
Interest rates are affected by the direction of commodity prices. Rising commodity prices are usually associated with rising inflation, which puts upward pressure on interest rates. Stock prices and interest rates are influenced by the direction of a country’s currency. A falling currency usually gives a boost to Stock prices quoted in that currency. This boost in Stock prices reawaken inflation fears and puts pressure on central bankers to raise interest rates, which has a negative impact on the stock market. Not all the time stocks are affected equally. Some times stocks get hurt in a climate of rising currency value; other times they actually benefit.
INTERMARKET ANALYSIS OF FINANCIAL MARKETS AT GLOBAL LEVEL
Global markets play an increasingly important role in intermarket analysis. The bear market years of 1987, 1990, and 1994 showed that world stock markets usually fall together at such times. As evidenced by the Asian currency crisis that started in 1997, currency trends, commodity trends, and interest rate trends are global in scope and have a major impact on each other. The 1970s witnessed a bout of hyperinflation that was global. The 1980s and 1990s saw disinflationary trends that were evident worldwide. As a result, global commodities were generally weak during those two decades, while global bond and stock markets were strong. At the turn of the new millennium, deflationary trends that started in Asia affected world markets everywhere. During the three years after bursting of the stock market bubble in 2000, the world’s equity markets fell together in a dramatic demonstration of global linkages.
AMERICA’S EFFECT ON INDIAN MARKETS
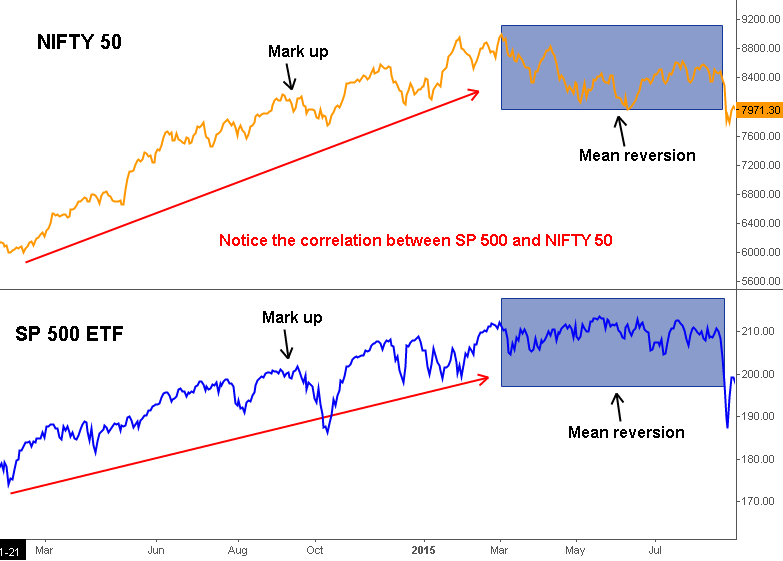
After the stock market bubble burst in the United States in 2008, the Federal Reserve lowered interest rates to record lows over eighteen months in trying to stop the bear market in stocks and stabilize the American economy. It did not work. Part of the reason, it did not work was the influence of deflationary trends coming from BRICS (Brazil, Russia, India, China and South Africa). By the year 2014, several changes took place in the global arena, which led to multiple policy rate cuts from developing countries. This created hot money flows across continent which resulted in tremendous correlation between Indian markets and American Markets. Read About Inflation here..
The deflationary trend in U.S. rates was largely the result of deflationary trends in the Far East. One did not have to be an economist to study price charts in commodity prices, bond yields, and the stock markets, and to see that all three were falling together. As is usually the case, market trends expect economic trends. It is difficult to separate market trends from economic trends. Economists have known for years that bond and stock markets expect economic trends.
PRACTICAL ADVANTAGES OF INTERMARKET ANALYSIS
Intermarket analysis represents another step in the evolution of technical theory and practice. With the growing recognition that all markets are linked—financial and nonfinancial, domestic and international—traders can take these linkages into consideration more and more in their analyses. Because of its flexibility and its universal application to all markets, one of the main advantages that Intermarket analysis has is the ability to plot several markets at the same time. They can easily chart the course of the dollar, oil, bonds, and the stock market. They can also chart the relative performance of stock market industry groups and sectors. The ability to chart so many things at the same time gives the trader a big trading edge. Remember that trading edge is trading success.


1 thought on “Introduction to Intermarket Analysis”
I am an active trader of nifty and bank nifty i use mt4 platform for trading. Kindly advise if i can talk to you on the mentor ship on trading.