Cipla stock prices are trading in a broad range. Market behaviour is volatile and interesting at the same time. We can witness a lot of Traps and Rejections in the Price Action.
Looks like large orders and transactions are quietly taking place behind the scenes in the stock.
Take a Look at the Price Action Analysis on 1D Chart
Cipla – Price Action on 1D Time Frame
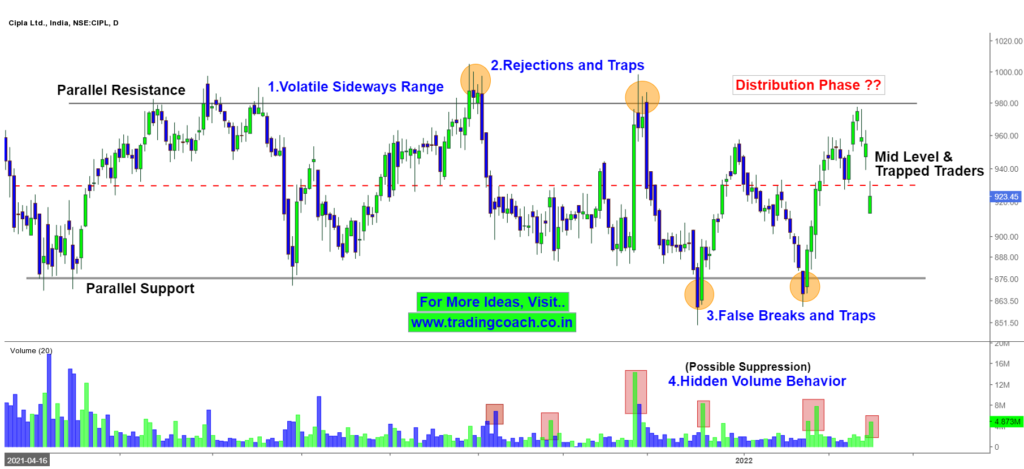
The Structure on the 1D Chart is very clear; it’s a Broad and Volatile Sideways Range. Prices are struck and trading within the range for the last couple of months.
The Potential Resistance Zone is around 980 and the Potential Support Zone is around 875. We can see a lot of traps, False Breakouts and Rejection around the Support and Resistance Zone.
Volume is consistently suppressed; we can notice the sprouts of the Trading Volume. Looks like some big players are behind the scenes. It’s also called Hidden Volume Behavior.
Based on all these observations, we can say that stock prices are likely in the Distribution Phase.
Given the volatility and numerous traps, traders and investors must be careful when initiating any position on the stock.
Also, it’s good to avoid taking any positions in the Mid-Level. Better wait for the Price Action to touch the Support and Resistance Zone, before making any trading decisions.
Keep an eye on this stock, as it may end up giving excellent opportunities in upcoming weeks.