Within 2 weeks, this stock had gone up by nearly 50%. Prices have rallied all the way from 400 to 600 with a strong momentum.
Good opportunities often take place in unpopular stocks; Goa Carbon is a great example; an Indian petrochemical company that is engaged in the manufacturing and sale of calcined petroleum cakes.
It goes by the Ticker symbol NSE:GOAC. Take a look at the Price Action Analysis on the chart, suitable for Swing and Positional trading.
Goa Carbon Share Prices on Daily Chart
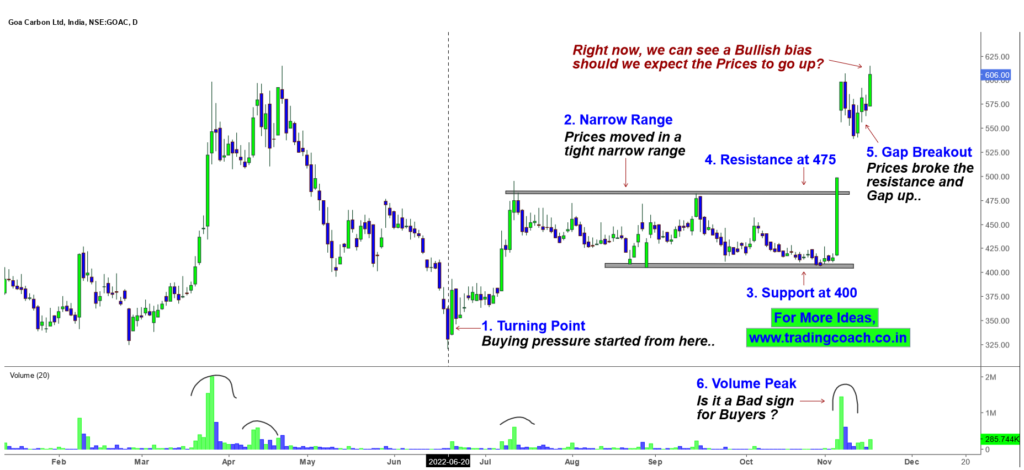
Prices moved in a tight narrow range for nearly 5 – 6 months. The strong support zone was at 400 and the strong resistance zone was around 475.
At the beginning of November, prices shot up sharply with strong bullish momentum and broke the resistance zone
Followed by Breakout at the Resistance, prices gapped up. Overall, the Price Action turned out into a Gap up breakout.
Right now, based on recent observations, we can see a good bullish bias in the stock. Should we expect it to go further up?
Well, the only issue is that Volume has peaked in the stock. Every time we see a volume peak, prices have reversed and changed direction. Could the same happen again?
Either way, keep an eye on the stock. It might provide an opportunity for swing and positional traders.
To learn about trading such stocks using Wyckoff techniques, checkout the video given below.