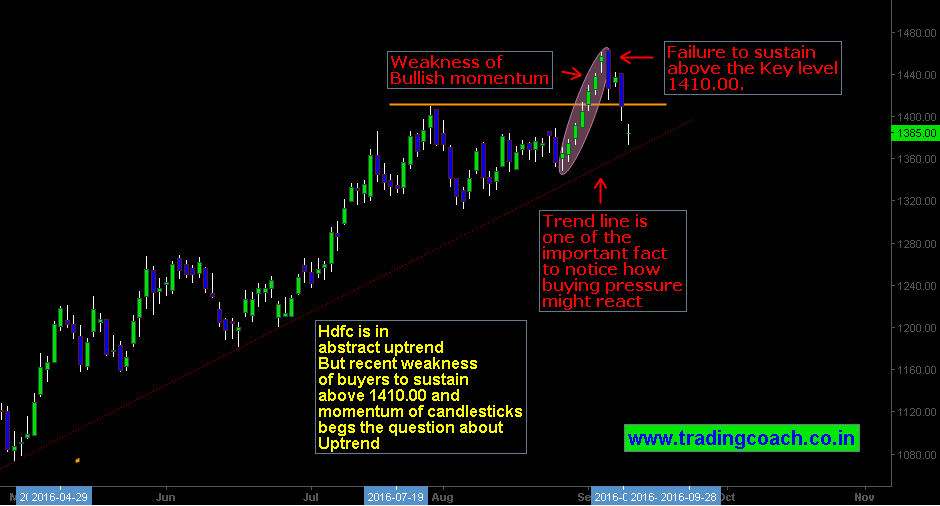
Housing Development Finance Corporation is in uptrend (when viewed from Daily chart) since March 2016. Most the likely it seems to be Intermediate trend spanning from weeks to months when taken in the context of Dow Theory. Dow Theory is set of techniques and methods used to study the big picture of market trends. Price Action traders don’t have many implications from Dow Theory except few tit bits. HDFC share prices trading higher from 1000.00 to 1400.00. The current price value (at the time of writing this article) stands at 1385.00.
Price Action Testing the Uptrend
Trend and Trend line are the important factors to observe in this stock. They can provide exact gauge on market sentiment and price behavior. We need to see how buying pressure reacts when price action touches the trend line, it might provide valuable insight about Market sentiment. HDFC is India’s first retail housing finance company and largest originators of housing loans in the country. So it makes sense to watch finance sector as well real estate stocks to predict the performance of HDFC. The stock has outperformed the Nifty from last few months but hit plateau after crossing 1400.00.
HDFC Technical Analysis | Previous Attempt of Trend Termination
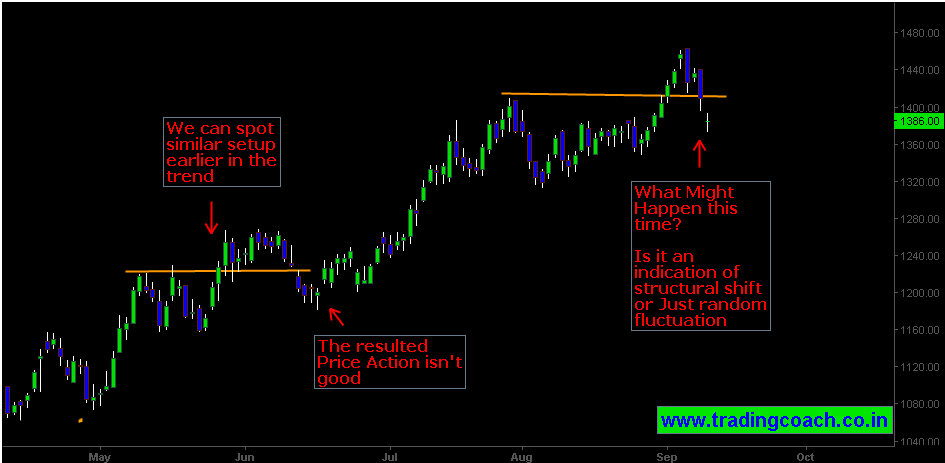
There’s no doubt that HDFC is in abstract uptrend, but the recent weakness of buyers to sustain above 1410.00 and decreasing momentum of buying pressure are creating some concerns for the stock. Precisely, market is testing the ability of buyers – checking out whether or not bulls will arrest the decline in prices. We can also spot similar attempt of trend termination took place within the market structure during the month of June 2016. It created a sense of uncertainty in Price Action. What might happen this time? Is the recent move indicating a structural shift or just random fluctuations? For Answers, watch the strength of buying and selling pressure.


