Once again, the sentiment has shifted on the Nifty 50 and most of the short sellers are washed out by the sudden change in the market behavior.
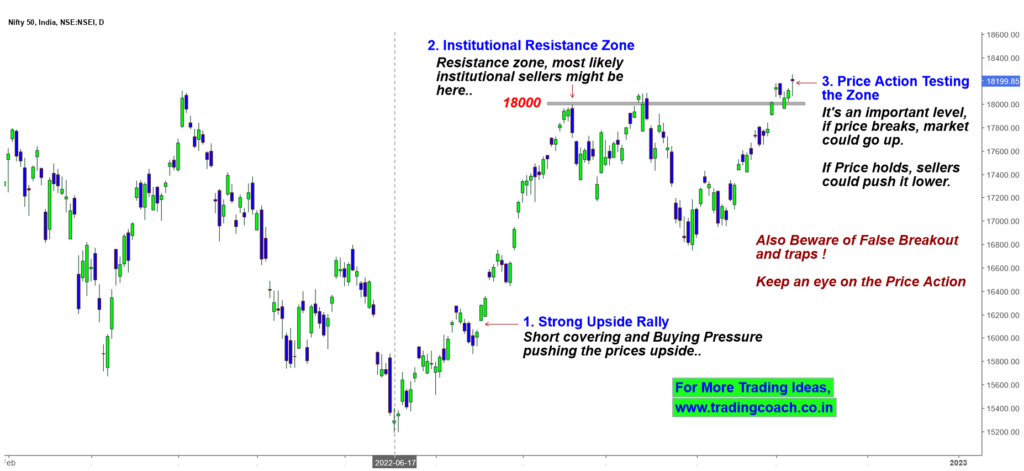
So far, the Index has rallied by 20% within 5 – 6 months. At the time of writing this content, the Nifty 50 was trading around 18200.
Even though it feels like bulls are in control of Price Action, there’s no clarity in the market direction. We can clearly see this, as there’s no proper structure in Nifty 50
Take a look at the Price Action Analysis on the Daily Chart
Nifty 50 – Price Action Trading Analysis on the Daily time frame

In the absence of a strong fundamental reason, Short covering and buying pressure has pushed the index prices so far to the upside.
Right now, prices are testing the resistance zone. Institutional sellers might be sitting around the major resistance zone at 18000
There’s a nice chance these institutional traders might have been trapped by the recent surge in index prices.
If the price holds at this level, there’s a good chance that sellers will try to push it lower. On the other hand, if the price breaks the important level then the market could go up.
So, traders and investors should keep an eye on the Price Action in the resistance zone and beware of market volatility which could create false breakouts and traps.
To learn more about trading false breakouts and traps, check the video given below…


