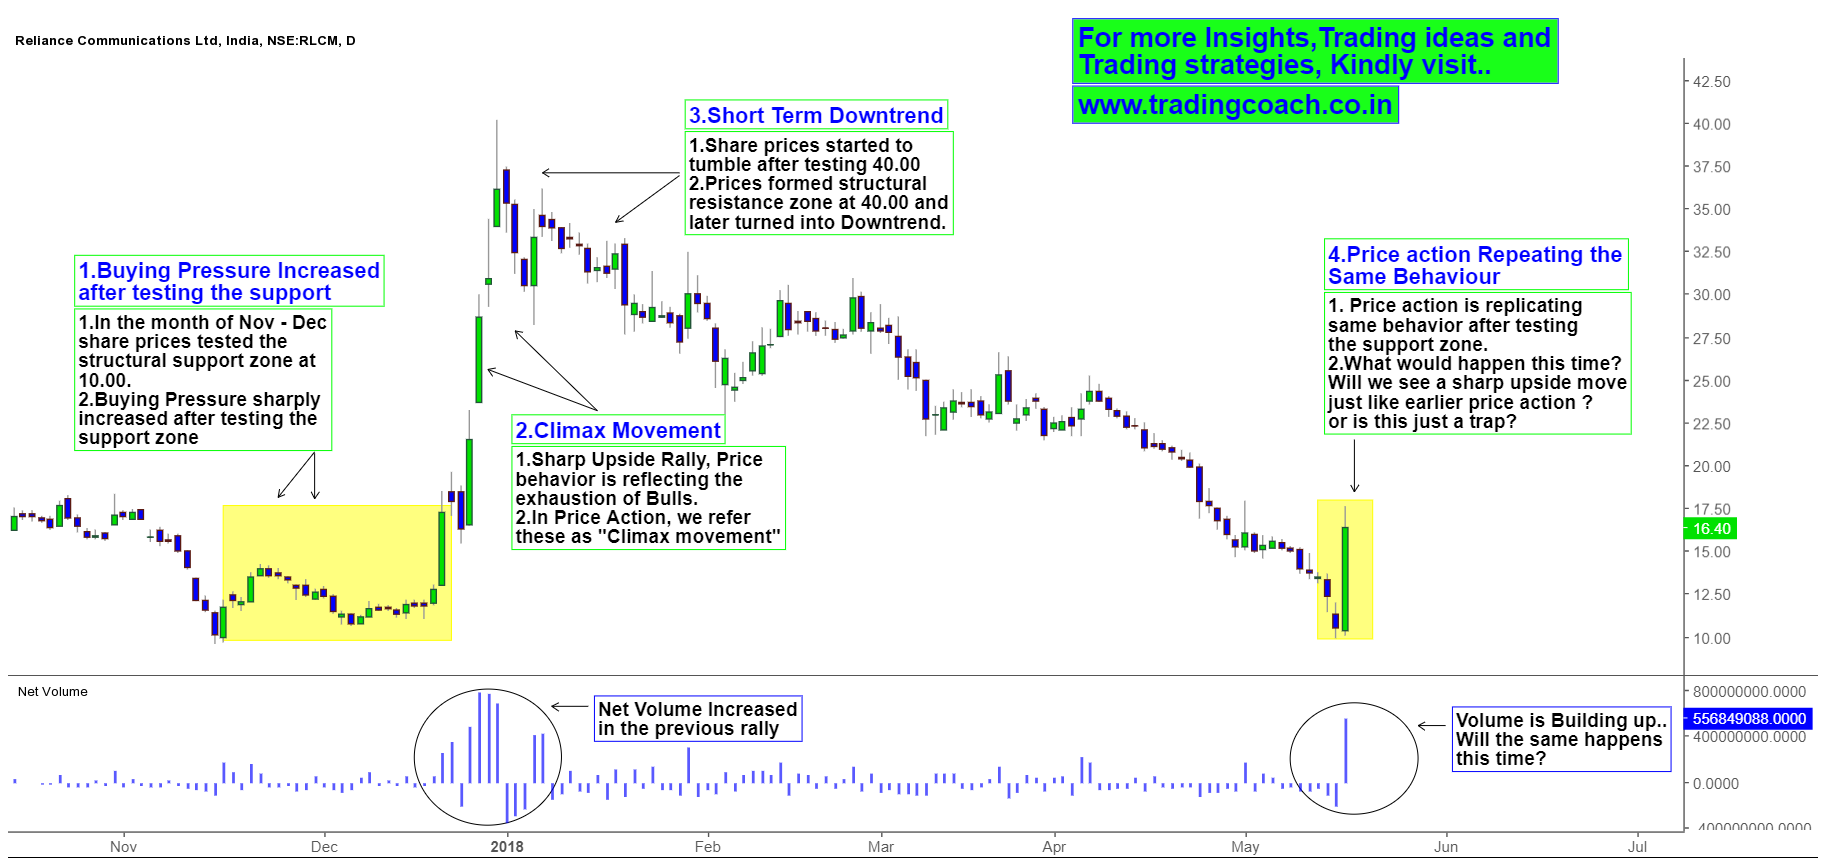
Whoever have said that Markets are efficient haven’t lived a single day as a Trader. People who think technical analysis doesn’t work must look at Reliance communications daily chart now. Price action is repeating a similar type of behavior we saw during Dec 2017. Recent jump in share prices might have surprised many market participants but it wouldn’t have made any difference for Price action Traders. Whether it turns out to be the same or not is something that we should watch in coming days.
Price Action Analysis on Daily chart – Repeating Market Behavior
During the Period of Nov – Dec 2017, Market tested the Support zone at 10.00 and witnessed a surge in Share prices. Buying pressure increased sharply after testing the support zone. Stock value jumped from 10.00 per share to 40 per share, within a month. In Correlation to that Net volume also increased.
But after touching 40.00, Price action formed structural resistance zone at 40.00. Reliance communication share prices started to tumble from the high and later turned into a Downtrend. Based on Market structure, we can consider it as a Short term trend. The downtrend persisted till Structural support zone. After touching the structural support zone at 10.00, Share prices bounced back.
Right now, something interesting is taking place at structural support zone. Price action is repeating a similar type of Market behaviour we saw during Dec 2017. What’s more Interesting is that, even volume has started to build up just like in the previous rally. What would happen this time? Will the prices shoot upside? Or will it turn into another false Indication? Just observe the Developing price action in coming days. In either case, this scenario proves that “Market prices do have a memory”!


