Stock Market Volatility (σ) is measured as the amount of fluctuations that we see in stock price. Higher the volatility of a particular stock, higher will be the risk trading that specific stock. It’s also associated with big Event spike formations. When the markets are too volatile it reflects fear and uncertainty among Market participants.
Measuring Stock Market Volatility
Volatility can be primarily measured in 2 different forms:
1. Standard Deviation
The most primary form of measure for volatility used by market participants is standard deviation. Standard Deviation will reflect upon the average amount of a stock’s price has varied from its mean over a period of time. Check out this link to know more about standard deviation
Bollinger Bands based on Standard Deviation
Chartists mainly use bollinger bands to determine the standard deviation over a period of time. Bollinger band consists of three lines:
a. Simple Moving Average (SMA)
b. Standard deviation above the SMA
c. Standard deviation below the SMA
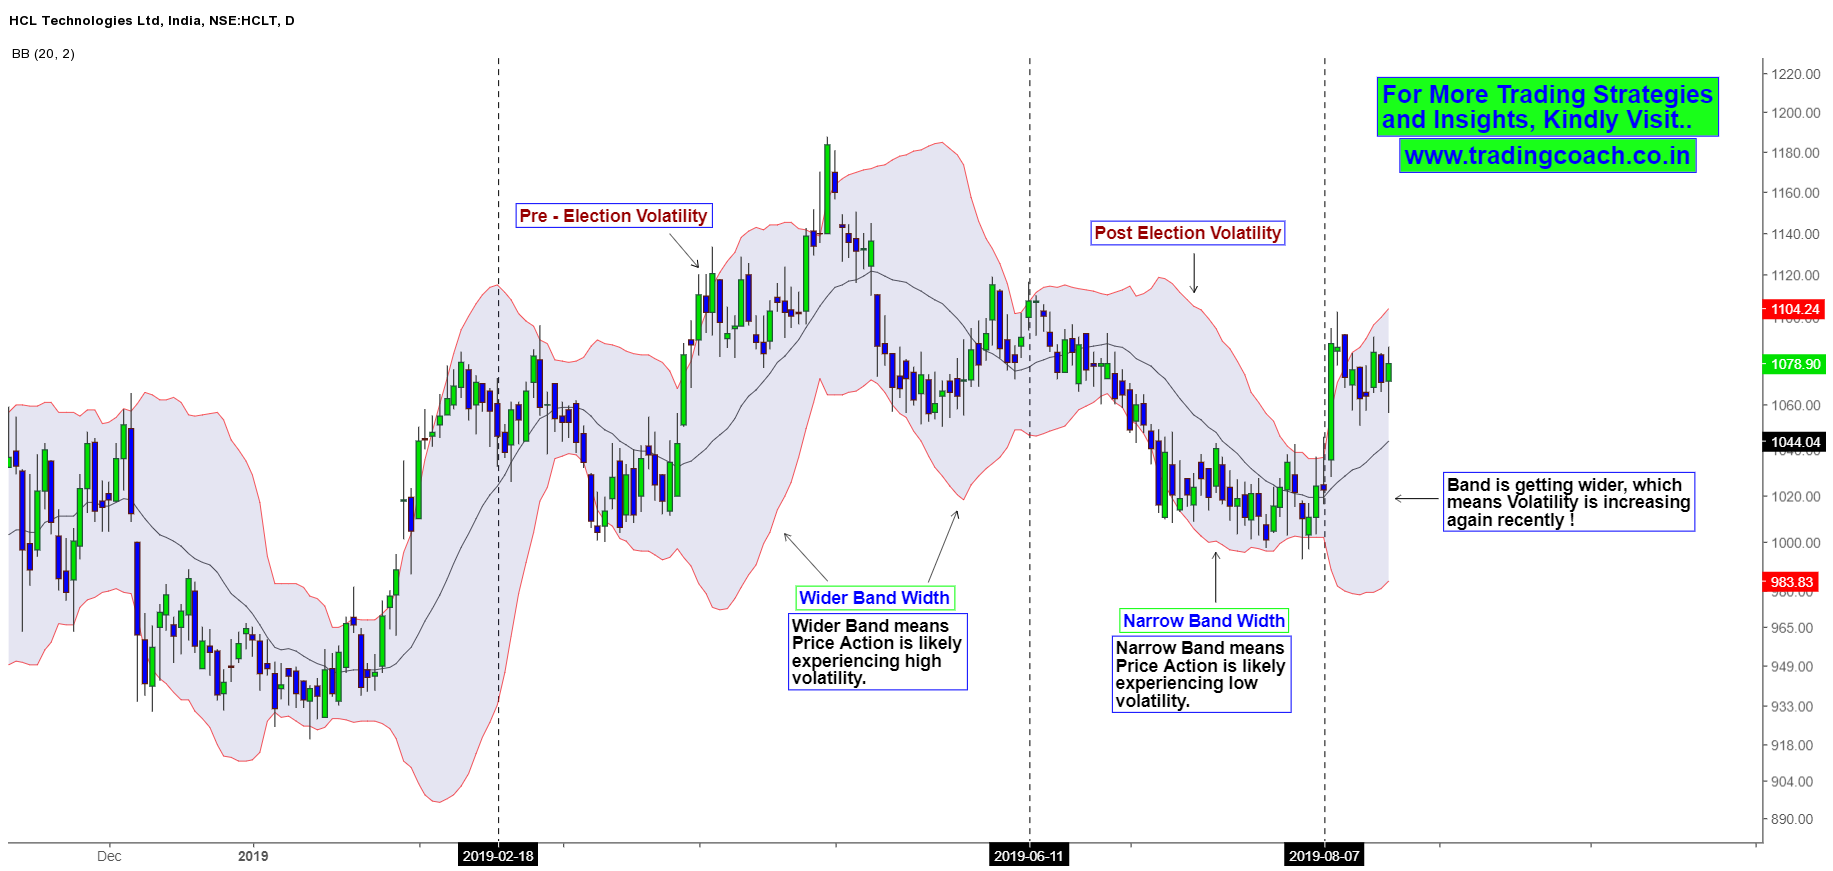
Bollinger bands with wide ranges are considered to be more volatile over a period of time. Whereas a stock with low volatility has Bollinger bands staying very close with the SMA. For example the stock prices of HCL Technologies has shifted from High Volatility to Low Volatility, before and after the elections.

As you can see from the image above, In the daily time frame of HCL Technologies over the range of six months, Bollinger band indicates the different volatility phases. Also, you can see big swing in price action across the chart with various spikes in candles. (Especially the one around 24 May, 2019 which formed as a part of pre–election rally.)
2. Volatility Index (Vix)
Volatility Index (Vix) is an index which measures the volatility expectations of the market for the short-term. Vix was introduced by National Stock Exchange (NSE) in 2008. The difference between market index and volatility index is that:
a. Market Index will showcase the direction of market movements and calculated based upon price movements of the underlying stocks. For e.g: Nifty 50, Sensex 30 and Nifty 500 etc. (of course, most of us are aware of it!)
b. Volatility Index will showcase the volatility of the market and will be calculated based upon the volatility of the underlying option contracts

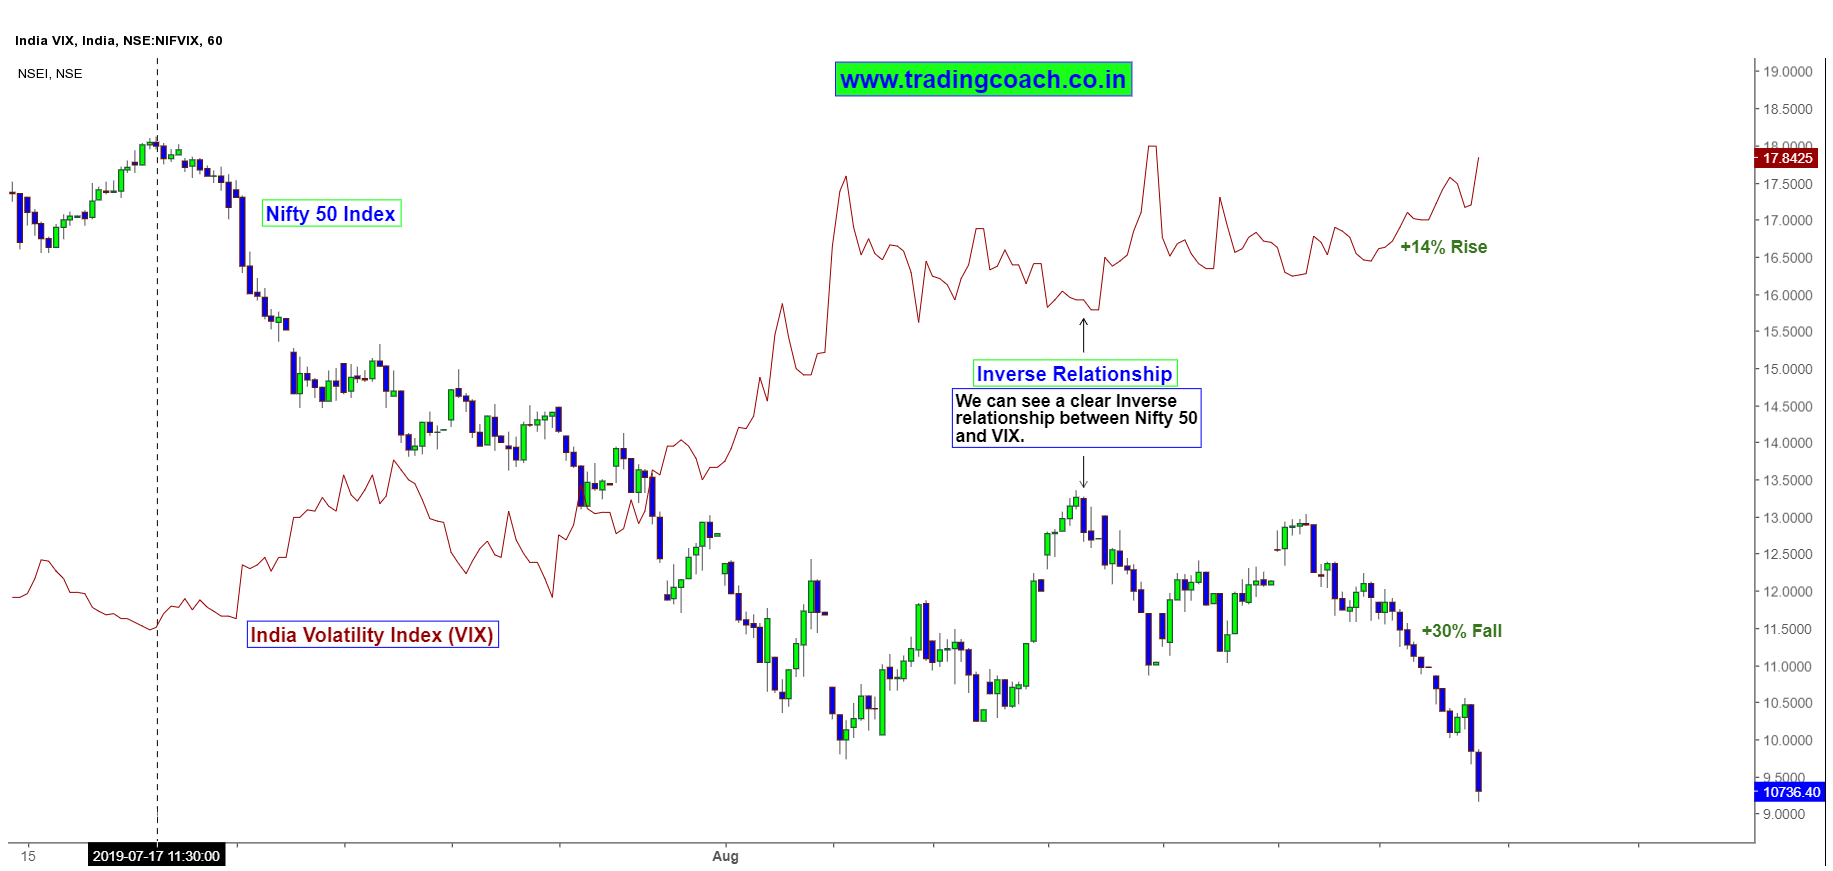
As per the above image, we can see that India Vix has an inverse relationship with the Nifty Index. When Nifty rises India Vix falls whereas when Nifty falls, India Vix rises.
Why it’s important for Traders to consider Stock Market Volatility?
Volatility is a precursor of both profits and Risk. As Volatility increases, traders will have potential to make large profits within a short period of time especially in derivatives. Similarly, traders will also experience higher whipsaws, frequent stop loss hits and the risk of above average losses.
So understanding the Stock Market Volatility will help traders to be prepared both mentally as well as tactically to manage the risks and utilize the opportunities that come along with it. Apart from that, Traders can structure their positions and stop placements as per the market volatility. For e.g: If the market conditions are highly volatile, it’s better to take small trades and place a wider stop loss so that your risk exposure will be less and you’ll avoid getting stopped out due to market fluctuations.
To put it in simple sense, Traders need good price movements to profit from the market. Understanding the status of Market volatility will help you find such circumstances. With proper understanding and consistent trading strategy, you can learn to use Stock market volatility for your benefit at the same time minimizing the risks that comes along with it.


