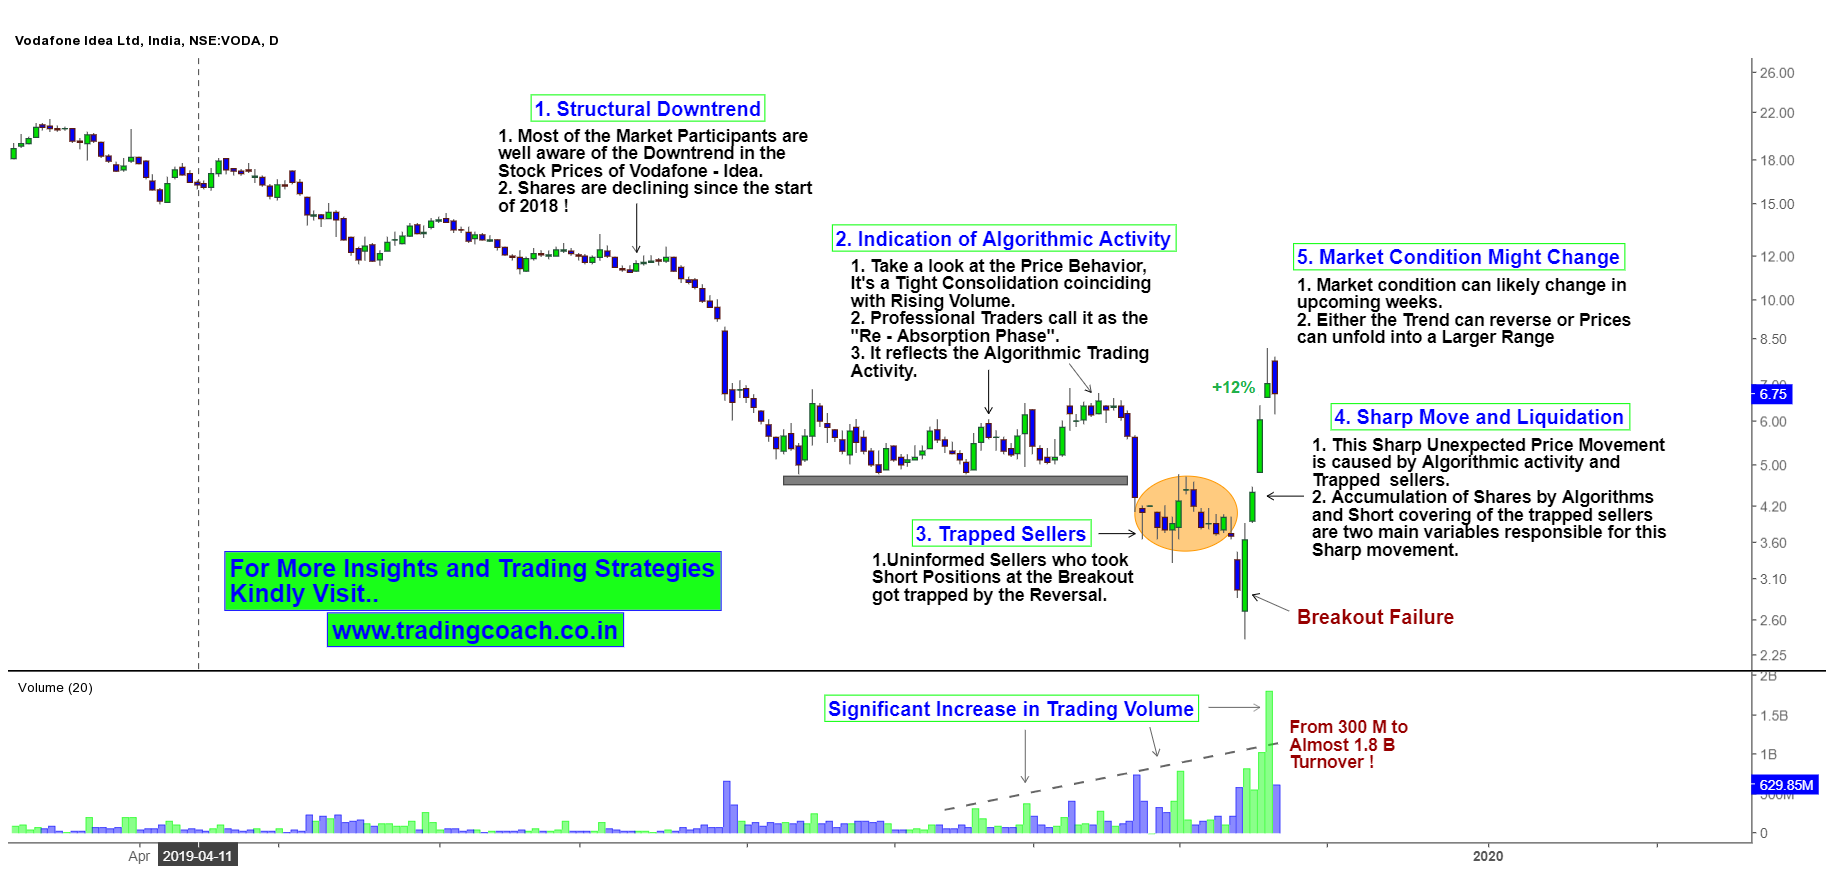
The beauty of Price Action Trading is that, it’s simple at the same time it’s also in-depth. When you strip down all the unwanted indicators and just focus on the Naked Price chart, it can reveal many things. One such interesting revelation took place recently on Vodafone Idea Stock prices.
Price Action pinpointed the Algorithmic trading behavior and how it trapped the last batch of uninformed short sellers. Take a look at the Price Action Analysis on the 1D chart of Vodafone Idea.
Vodafone Idea – Price Action Analysis on 1D Chart
It’s a well-known fact that most of the companies in Telecom sector are struggling to keep up with competition. Due to the same reason, the share price of Vodafone Idea Ltd is on a multi-year downtrend. If you look at the Weekly chart you will notice that share prices are declining since the beginning of 2018. The company has already lost ¾ of its market value.
But at the same time, Algorithmic trading activity has increased in the stock. How do I know that? Well, take a look at the significant increase in trading volume – Just a couple of months back, the average volume of the Stock was 300 Million, but from last 3 – 4 Weeks, volumes have increased significantly up to 1. 8 Billion!
Not only that, between 9th August to 18th September, share prices were trading in a narrow and tight consolidation range, along with Rising volume. Professional Traders will call this type of Price action as Re – Absorption Phase. It’s a reflection of Black Box Algorithmic trading activity, similar to what I have mentioned in HFT Compressor Pattern.
Another interesting fact is, notice how the downside breakout followed by the Re – Absorption phase failed drastically. Uninformed sellers, who initiated short positions on the breakout got trapped and forced to square off their positions due to the sudden upside reversal in Price Movement.
The sharp unexpected Upside price movement we see now is the result of Algorithmic Activity that has trapped uninformed Short sellers. It’s interesting to see how algorithms are becoming more and more sophisticated in Financial Markets.
So Important lesson from this chart for Traders like us – Is to understand the importance of Price Action, How Algorithms and High frequency machines can impact the Price Action and finally, never be an Uninformed Trader.

