There are some Stocks which are silent movers, often don’t show any signs of momentum buildup but all of sudden we might see explosive movement in the Share prices, Vodafone idea turned out to be one such of a stock !
The Prices were struck in a narrow range for almost 75 Days and then turned into a violent breakout in the beginning of December 2021. Take a look at the Price Action on 4h Chart
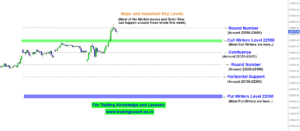
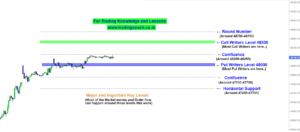
Vodafone Idea Price Action Analysis on 4h Chart

I have already pointed this out on our telegram channel. (Free to join of course!!)
Given the factors such as lower price, less liquidity and High Volume, the Stock Prices rallied by more than 45% just in a matter of few days, right after the Breakout.
The Breakout happened exactly in the First week of December and the Volume Increased sharply during the period of Breakout. Increasing Volume also Indicates big order flow getting into the Stock
We can expect the Bullish Momentum to continue unless and until we see any sharp selloff in the Stock Prices. One can try to set up positions based on Pullbacks and retracements on the price; also it’s better to avoid jumping into the stock at the peak value. The Breakout zone at 12.00 can act like a potential Support Zone, if the prices retest.
The Potential Resistance is at 18.00, if market breaks the resistance zone with strong upside momentum, then we can expect the prices to shoot up till 20.00.
Traders should keep an eye on the Price Action and take decisions accordingly.