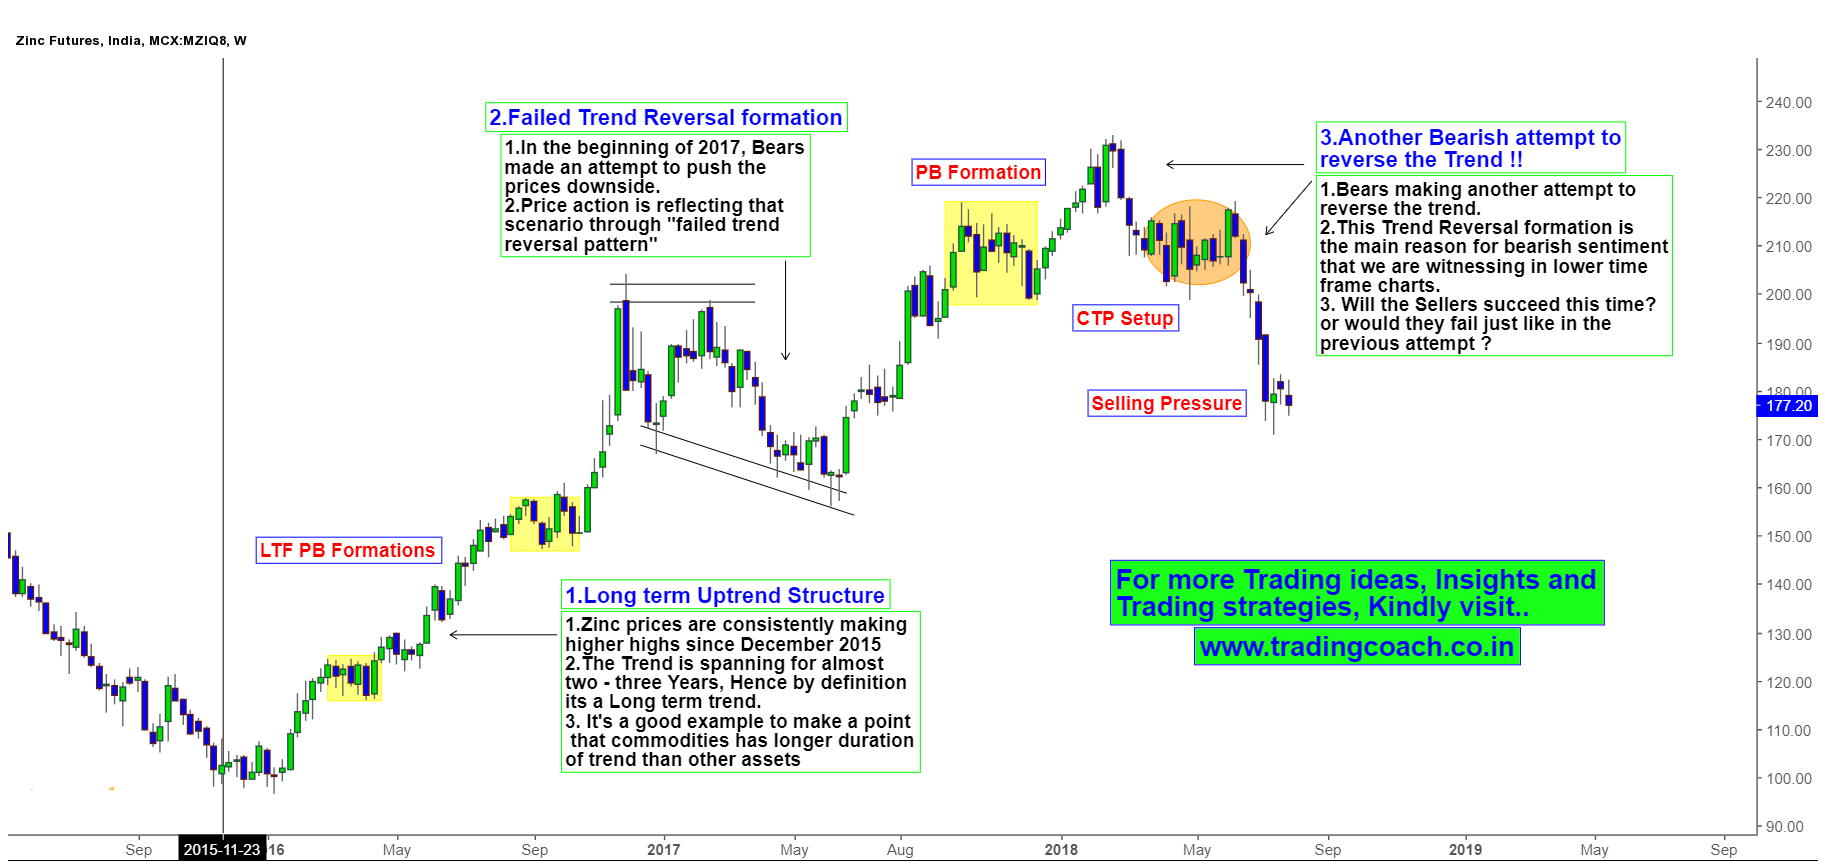
Since the month of June, most of the base metals are having a bad time. The MCX benchmark metals such as Copper, Aluminium, Lead, and Nickel tumbled from the Highs. On the other hand, Zinc lost the shine and dropped to multi month low. It’s the worst performing non – ferrous metal so far this year, losing about 28% from its February highs. In the recent scenario, Zinc prices are trading somewhere close to 180. Price action analysis on weekly chart reveals the overall outlook of Zinc.
MCX Zinc – Price action Analysis on the Long term Trend
The Overall Market structure of Zinc in Weekly chart is In Uptrend. We can see this trend started all the way back in October 2015. Hence by definition it’s a Long term trend. Primary reason for this uptrend was improved economic growth and commodity market cycle. The momentum of trend was pretty strong in the earlier stages until bears tried to terminate the trend in 2017.
The failed trend reversal formation at 200 is the first indication of selling pressure. It technically tells us that counter trend players tried to push the prices downside but eventually failed. Price action simply reflected this psychological trait through failed trend reversal pattern. Then again from May 2017 – Feb 2018, Zinc prices rallied from 170 – 230.
But from the second week of Feb 2018, Zinc prices started an elongated downfall because of global trade tensions and concerns of supply glut. Strong dollar further rectified the selloff which in turn influenced the negative sentiment. These factors caused another trend reversal formation in the Market structure of Long term trend, which is also a main reason for bearish sentiment that we are witnessing in lower time frame charts. Will this trend reversal formation succeed? or would it fail just like in the earlier attempt? It’s an inflection point; hence traders must watch the Price action on weekly chart in coming days and take decisions accordingly.


