In a bullish trend, if every investor expects a further rise in stock prices, the thought of reversal or a correction wouldn’t worry much. But it’s a reason for prudent trader to become cautious. Experienced Investors and traders will understand this phenomenon better; and will stay focused on their trading without getting carried away by the biases of bullish trend following crowd. There are certain indications that can give clues before a correction is about to take place and traders who can spot these indications will be protective when market corrects from its peak or top.
How to look for a Market top?
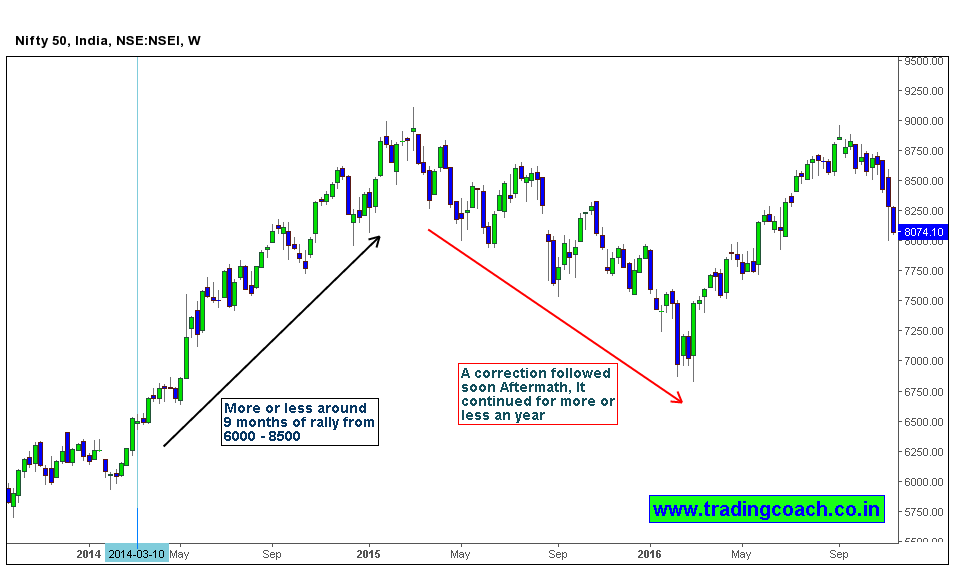
For a market top or peak to form, stock prices should trend for 9 consecutive months, even if there are small ups and downs in between. Waves of up and downs in the trend is a part of it. For a market top analysis to be consistent, 9 months of Price rally is necessary.
Trends can sustain for a longer period and nine months is a sample estimate for a trend as per the historical data and statistics. It is a short-term rally which needs to be analyzed if you are looking for a market top. The average bull market within 1960 and 2007 was 56 months. We take an average of 9 months rally, so that traders neither over trade nor exit the market very early in process. After 9 months price rally, there’s a tendency of market prices to retrace or correct.
Three Indications that signals a Market top or Peak
These signs will help traders to understand the strength and weakness in overall market and gives a deeper insight on market prices. When the correction is about to happen, these first two signals are perceived before and the last one happens as a confirmation of Price action Reversal.
1. The decline in the number of 52-week highs, even if the indexes are rallying upside: If the number of stocks making 52-week highs are declining, then it is an indication that only a few stocks are trying to push the market upwards, as a result the trend can fail to move higher.
2. Nifty index and Sensex are making higher highs, but FII and DII holdings are declining after a peak: Nifty and Sensex is moving higher, but FII and DII will be reducing their holdings – which show less conviction and participation on the rally. As result of low investor confidence, market trend can change or come to a stall.
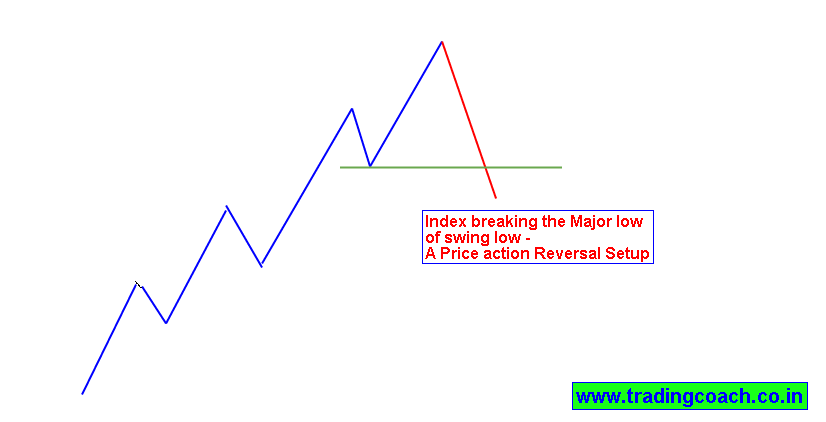
3. Major indexes breaking the previous low (swing Low): When market is in uptrend, it makes higher highs and higher lows. If Prices clearly breaks the previous swing low and moves below, it technically means that uptrend has come to an end. For analyzing this indication you need to use weekly or daily charts.
When all three Indications align together, it calls for a major market correction. Prudent traders will use these signs to exit the market and wait for a continuation setup before they re-enter.
Summary
When the above-mentioned signals combine together, there is a reason to think about the possibility of market correction after the top. Decline in 52- week highs and a fall in Institutional holdings can indicate a loss of momentum and confidence. If Price action breaks the previous swing low, it can act as a confirmation for changing market direction. I normally pay attention to these signs when I do trend trading on my positional stock portfolio. Over the years, it has helped me to avoid significant losses that can result from trading over extended trends and following corrections.
When all these factors combine, it clearly signifies that the uptrend has broken and correction is on the way.