

“So folks just watch out the USD/INR Price action around the zone 64.25-64.00. Also keep an eye on this week’s economic calendar and News events”.
This is following weekly chart of USD/INR. There are few things we can point out by looking at this chart.
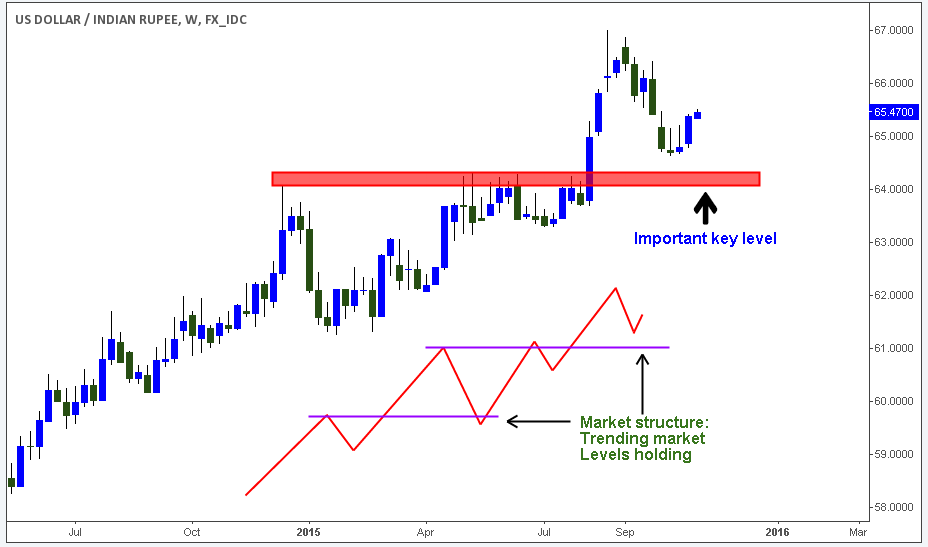
USD/INR has fallen down from 67.00- 64.50. From last 3 weeks (almost nearly an October) Price is holding around 64.50 which is just above the key level of 64.25 and 64.00. And also by looking at the Market structure we can see that Price action is in long-term uptrend. (Look at the red diagram in the chart). Market structure is from our proprietary price action analysis. All these show that, USD bulls are still in track. From these following observations we can conclude, there is more chance that USD/INR will once again moves upside by touching the key level zone at 64.25-64.00.
From the perspective of Macroeconomics, three prime factors that influence the market conditions are:
1.US Federal reserve and their monetary policy cues
2.RBI’s Interest rate commitment
3.China’s economic situation.
So folks just watch out the Price action around the zone 64.25-64.00. Also keep an eye on this week’s economic calendar and News events.Remember today is November 2, 2015, A new month which means new economic releases and reports; it will add heavy volatility in the markets. Traders stay safe and happy trading.


