As we are nearing the end of April, Crude oil is talk of the town. Steady uptrend throughout is influencing investor sentiment in both MCX and Global markets. Trend systems could’ve resulted in consistent profits. Price action is trading in Mark up structure; we should focus of price action at 42.50 and 41.00 for potential trading opportunities and price action setups.
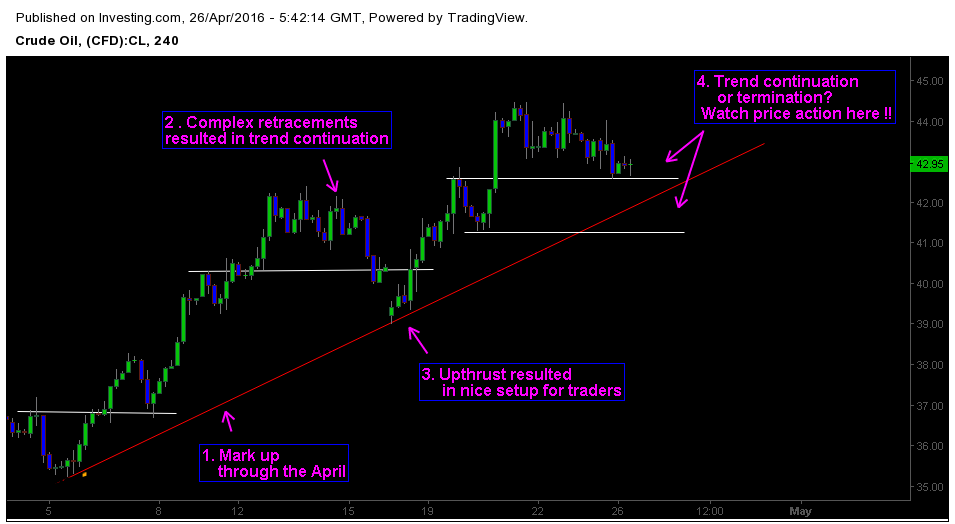
Below is the 4h chart of Crude oil, covering price action analysis for the month of April 2016. Current price value of Crude oil is 43.00 dollars per barrel on International market.
1. Price action is trading in Wyckoff’s Mark up phase
From the beginning of April 2016, buying pressure dominated the price action in Crude oil. Seasonality factors and positioning factors could’ve resulted in these movements. Commodities usually outperform other asset classes in April due to supply and demand tendencies. Technically crude oil is in Wyckoff’s Mark up phase. Structural support is at 35.50.
2. Complex retracements resulted in trend continuation
Complex retracement is a price action pattern similar to pullbacks. Complex retracement tests the market trend and conviction of market participants. In this case, Crude oil price gained as a result. Market shakes out the weak hand players during complex retracement pattern.
3. Springs and up thrust resulted in nice setup for traders
Springs and up thrust patterns traded by Richard Wyckoff. I cover more in-depth about these patterns in my trading course. We can trade springs and up thrusts in both ranging and trending markets. Up thrust price action setup at 40.00 provided a nice opportunity for traders. Many up thrust and spring patterns created successful trading setups on Lower time frame.
4. Will the trend continue or terminate?
Crude oil is once again forming complex retracements and most likely will test minor key levels at 43.00 and 41.50. Also it’s important to note that momentum is deviating from price action. Traders should focus on key levels and keep an eye on higher time frame price action

