Nifty turned out as the most rigid market structure this week – breaking the resistance level at 8000. Price action indicates different perspective in different time frames. Nifty gained 2.50% from last two days and yesterday futures expired in an optimistic mood. Global markets are dominated by news reports from United States and FED expectations are playing crucial role. Currently nifty is trading at 8123.60 (at the time of writing this article)
Below is the 4h chart of Nifty with Price action analysis
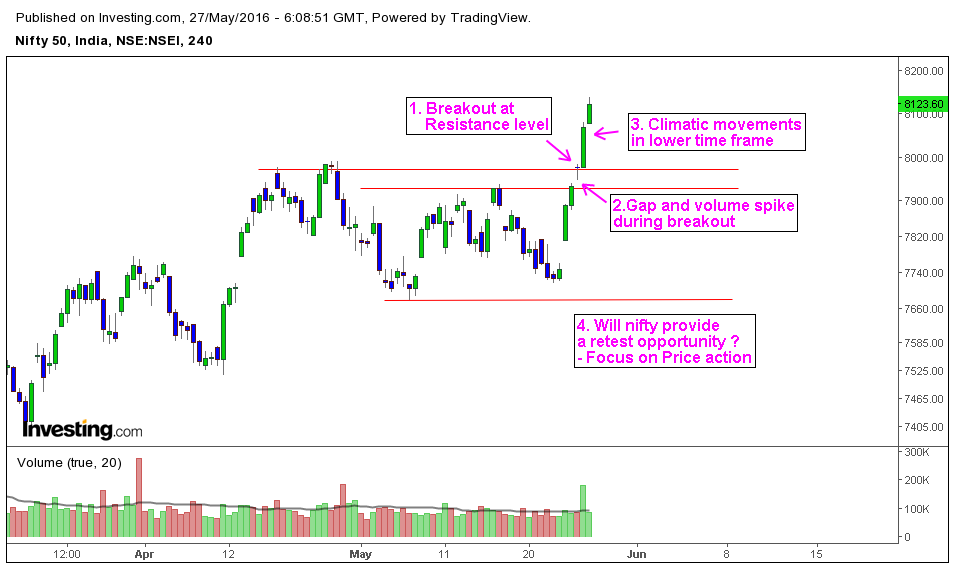
1. Price action broke the resistance level at 8000
Nifty is trading this week in a highly optimistic sentiment. Price action broke the resistance level at 8000 indicating the momentum of buying pressure. Traders should evaluate the strength of selling pressure before taking any trade decisions. It’s worth paying attention to how sellers will react at upcoming resistance levels. Today’s market close can give some valuable clues about future direction.
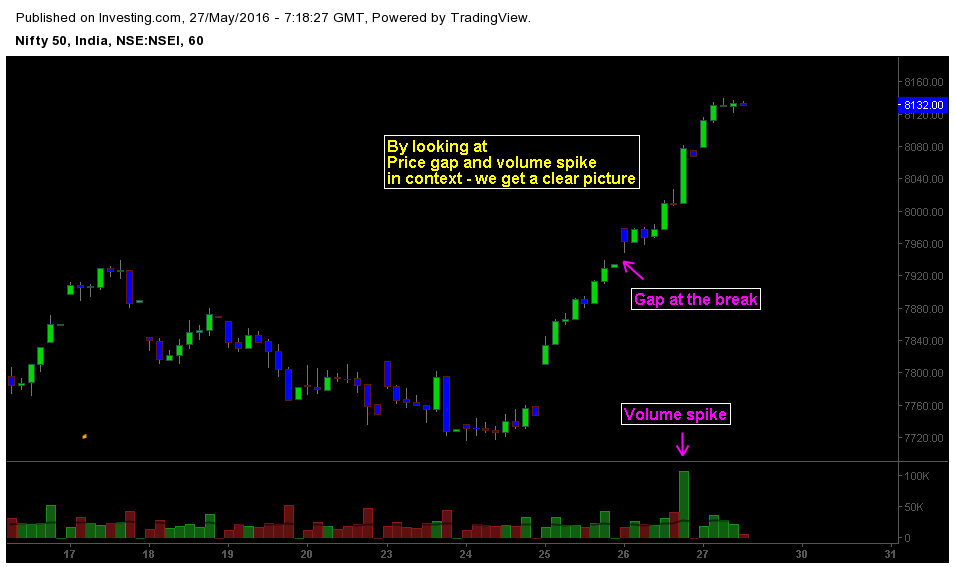
2. Volume spiked and market gapped while breaking the resistance level
Another important factor is to notice the volume spike and volatility indications. But we should consider them in the context of market structure. During breakout at 8000 – volume spiked and market gapped up with high liquidity – volatility factor. Technically it means more conviction behind price action
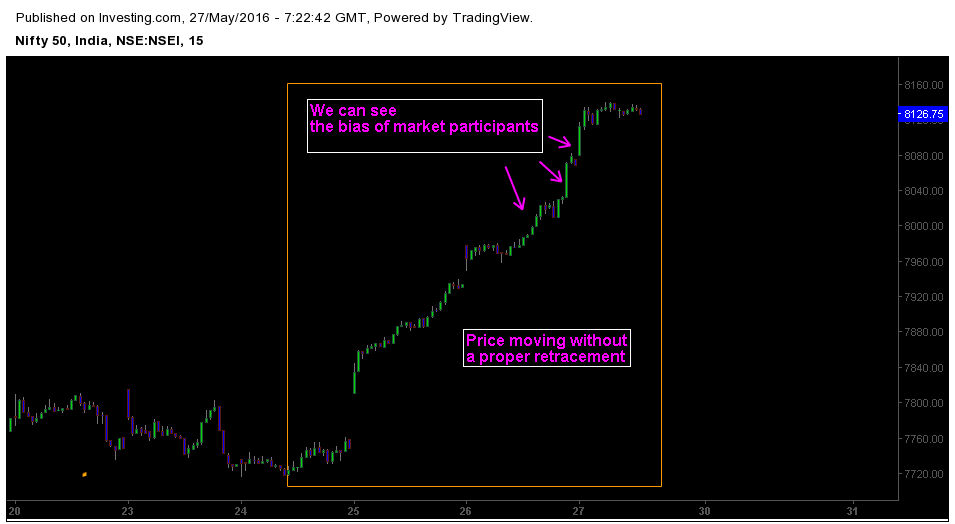
3. Climatic movements in Lower time frame.
In lower time frame charts, Price action provides a clear hint about market psychology and the mindset of market participants. It shows what traders could’ve experienced at specific time. Climatic movements and euphoric sentiment are clearly visible in lower time frame charts. The reason we to rely on Multi time frame price action to get proper inference.
4. Will nifty retest the resistance level at 8000? Or will it succumb to selling pressures?
To get proper answers and better gauge of market bias, traders should focus on how price reacts at specific key levels. Also keep an eye on Lower time frame price action to get clues on Market direction. Today’s market close will offer some hints about next week’s price action.