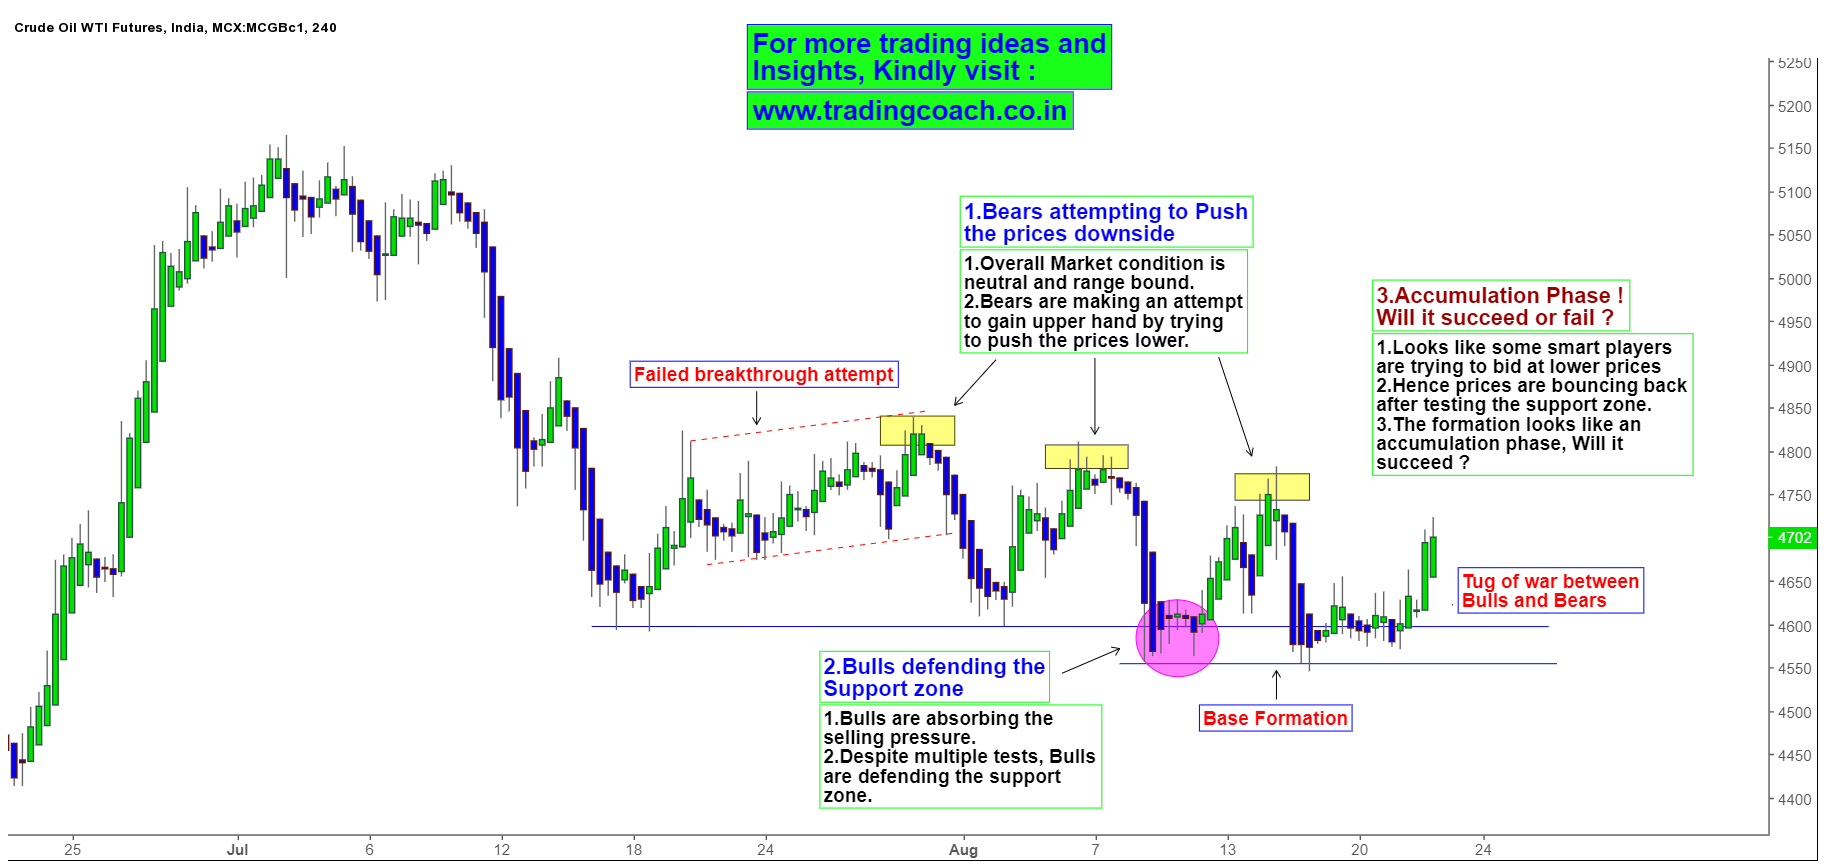
Again in the energy segment, Crude Oil is taking the spot light. Recent Inventory reports and US – Iran sanction drama has kept the Investors astray on Oil prices. Global Crude Oil benchmarks posted a fourth straight gain matching its longest short-term rally since July 20. But still in the Intermediate time frame, Oil prices are range bound. Here’s the Price action Outlook on 4h MCX chart of crude Oil.
Crude Oil Price Action Outlook on 4h Chart
In commodities, 4h time frame is referred as dealers chart. It’s because most of the International commodity dealers use this time frame to route orders and make decisions. Hence we can get an insight on Intermediate term by doing Price action analysis on 4h chart.
Since Mid-July the overall Market condition is neutral and Range bound. From august onwards, Bearish momentum increased and sellers tried to push the prices downside. On the other hand, Bulls defended the support zone despite multiple tests and absorbed the selling pressure. These back – forth movement indicates the Tug of war between bulls and bears.
Fundamentally, US Sanctions on Iran are due to come into full force in November. It can potentially impact the global Oil supplies. Inventory report on Wednesday reported a fall in Oil inventories by 5.836 million barrels compared to last week. If this continues further then crude oil supplies might decrease drastically. Major Institutional investors will pay attention to news and events related to these factors in upcoming weeks; hence it can affect the market sentiment.
Based on Wyckoffian Perspective, the formation also looks like an Accumulation phase. Some smart players are bidding at support, that’s why prices are bouncing back from the support zone. Whether the accumulation succeeds or not is something we should wait and watch. Further development of Price action would be interesting to keep an eye on. Traders must watch the Crude Oil price action and related fundamentals to make informed trading decisions.


