Infosys released their Q2 results in which they’ve reported 13.8% growth in consolidated profits (much of it has to do with foreign inflows). In the recent market turmoil, some sectors like IT, Manufacturing etc., didn’t suffered much Impact. Probably it has to do with their dependency on Dollar revenue, as higher dollar prices kept their earnings and profit Margin stable, which boosted Investors’ confidence. Though Price action didn’t reflect strong declines, neither it had showed any buying interest. Right now, Share prices are consolidating in a Narrow range, Daily chart of Infosys clearly reveals the picture.
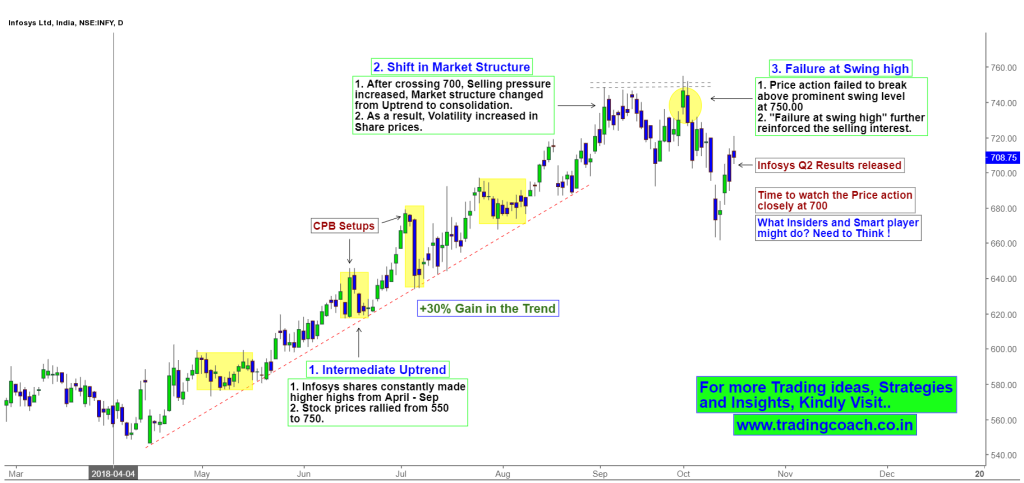
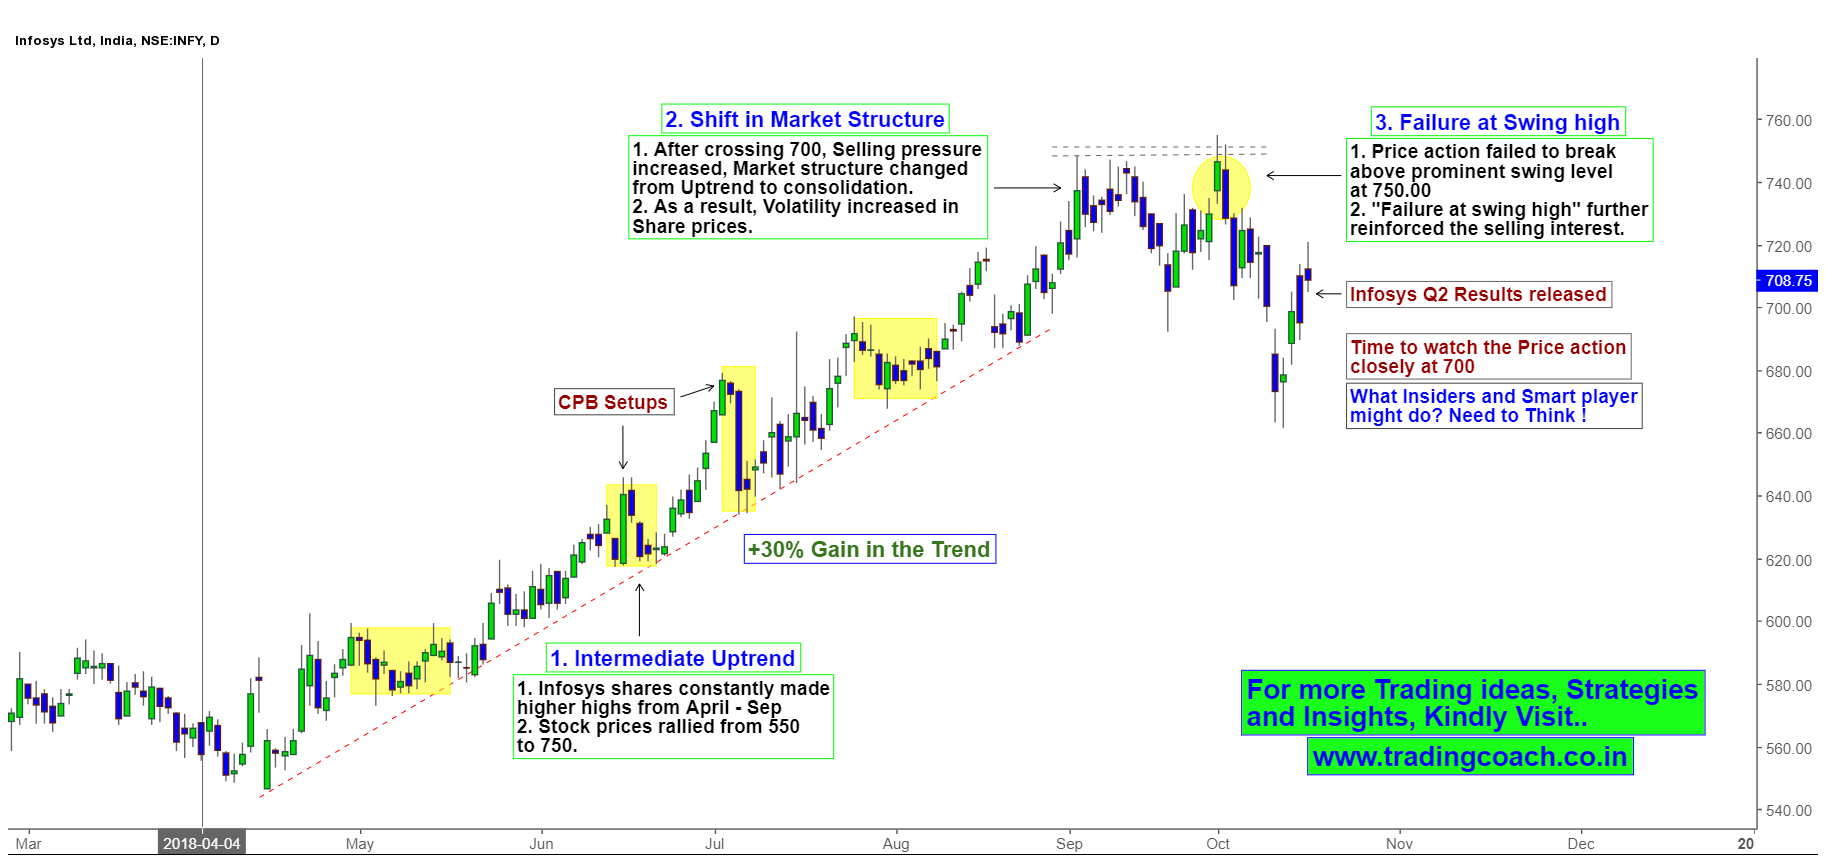
Infosys Share prices on Daily chart, Price action forms failure at Swing high
Stock prices rallied higher since April 2018, Uptrend continued till mid –September. Share value increased almost 30%, from 550 to 750, just in a period of 6 months. But after crossing 700 Selling pressure increased in the stock. Market structure changed from Uptrend to narrow consolidation. Even Volatility increased as a result of changing Market structure but Share prices didn’t witness any drastic falls or climax moves.
The turning point happened when prices failed to break the swing high at 750, which further reinforced the selling interest on stock. We can refer 750 as a potential resistance zone, in order to trend higher price action must clearly break and retest the zone. Even the release of Q2 results didn’t create any significant price move in Infosys. That should make astitute traders to question the intention of Smart players and Insiders! Even with a satisfying Q2 result, we couldn’t see any sharp moves, now that’s suspicious. In coming days Infosys might provide good opportunities for Swing traders and short term traders. We need to keep a close eye on price action and take trades according to setup formations.

