

India Bulls Housing finance is one of the volatile stocks in financial sector. Recent panic and turmoil in NBFC has created a major impact on Share prices. Since the beginning of September 2018, IBHF lost around 40% of its market value. If we look at the daily chart, it’s pretty obvious to spot the downtrend. The trend has begun in Mid-August and still intact, share prices tumbled from 1400 to 700 over the period.
India Bulls Housing Finance – Price Action Analysis on Daily chart
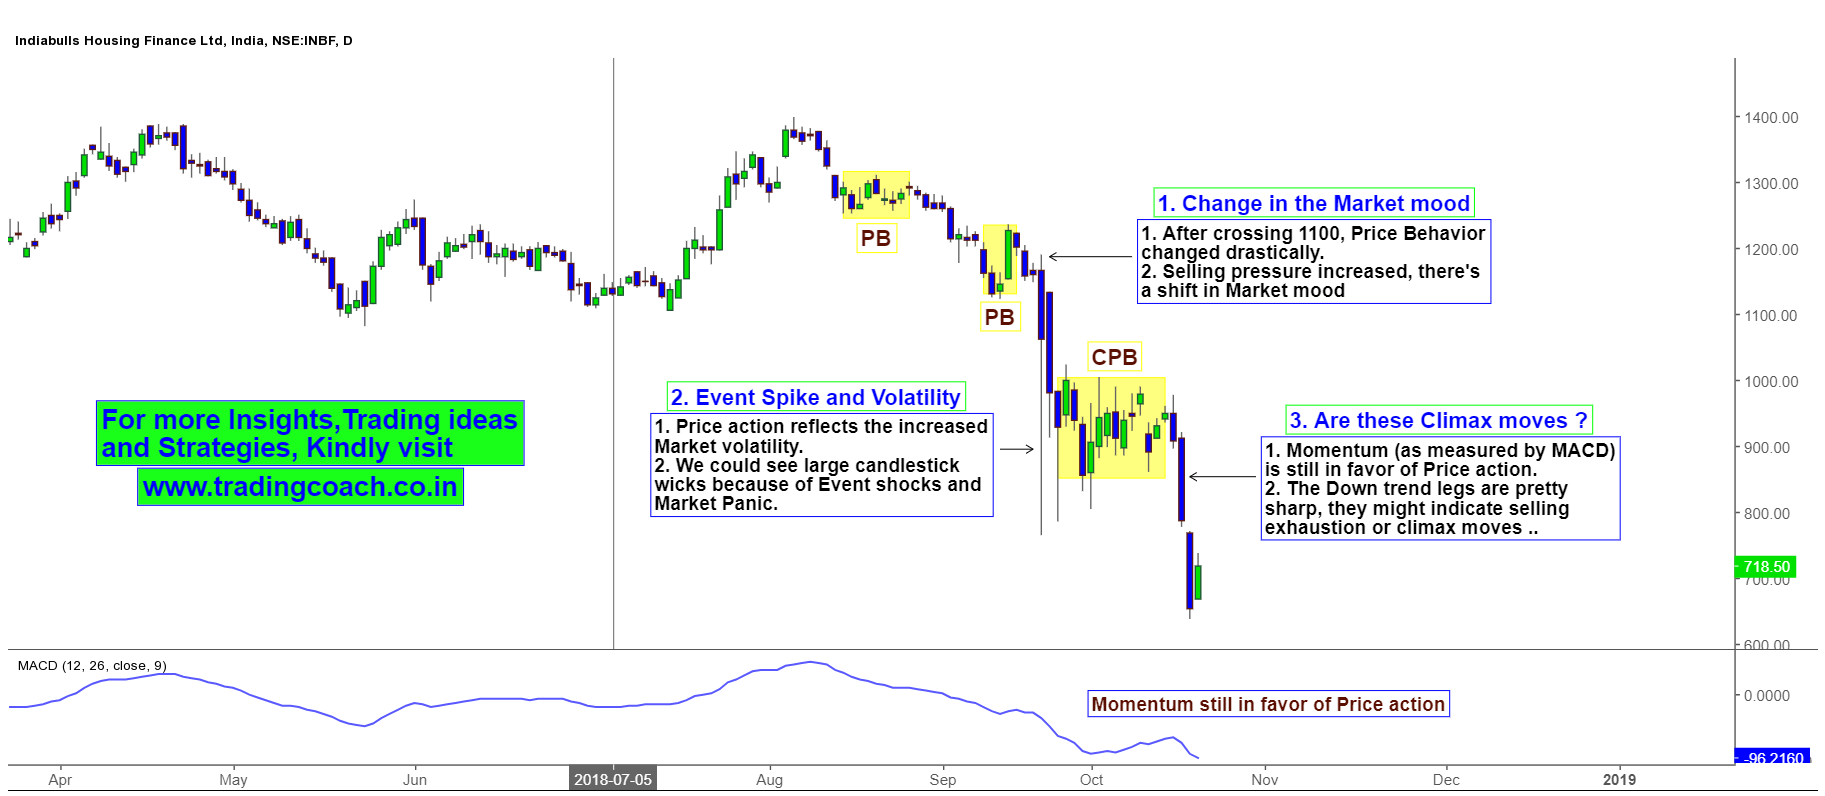
Even though the downtrend started around Mid-August, Selloff intensified after share prices broke the key level at 1000. Price movement correlated with market panic and IL&FS events, adding fuel to the fire. We could see large candlestick wicks because of these Event shocks. In lower time frame, all these formations represent Event spike Pattern.
From the beginning of October, Momentum values (measure by MACD) declined sharply. Price action and momentum correlated with each other. Recent trend leg formations resemble climax moves which may lead to exhaustion of Sellers. On the fundamental side, a recent report claims that India bulls Housing finance is planning to sell some of its stakes from Oak north, market participants will perceive this as positive news which could turn around the share prices.
In coming days, we may get some potential contrarian trading opportunities in India bulls Housing finance. Short term traders and swing traders should add the stock to their watch list. Also keep an eye on Developing Price action.


