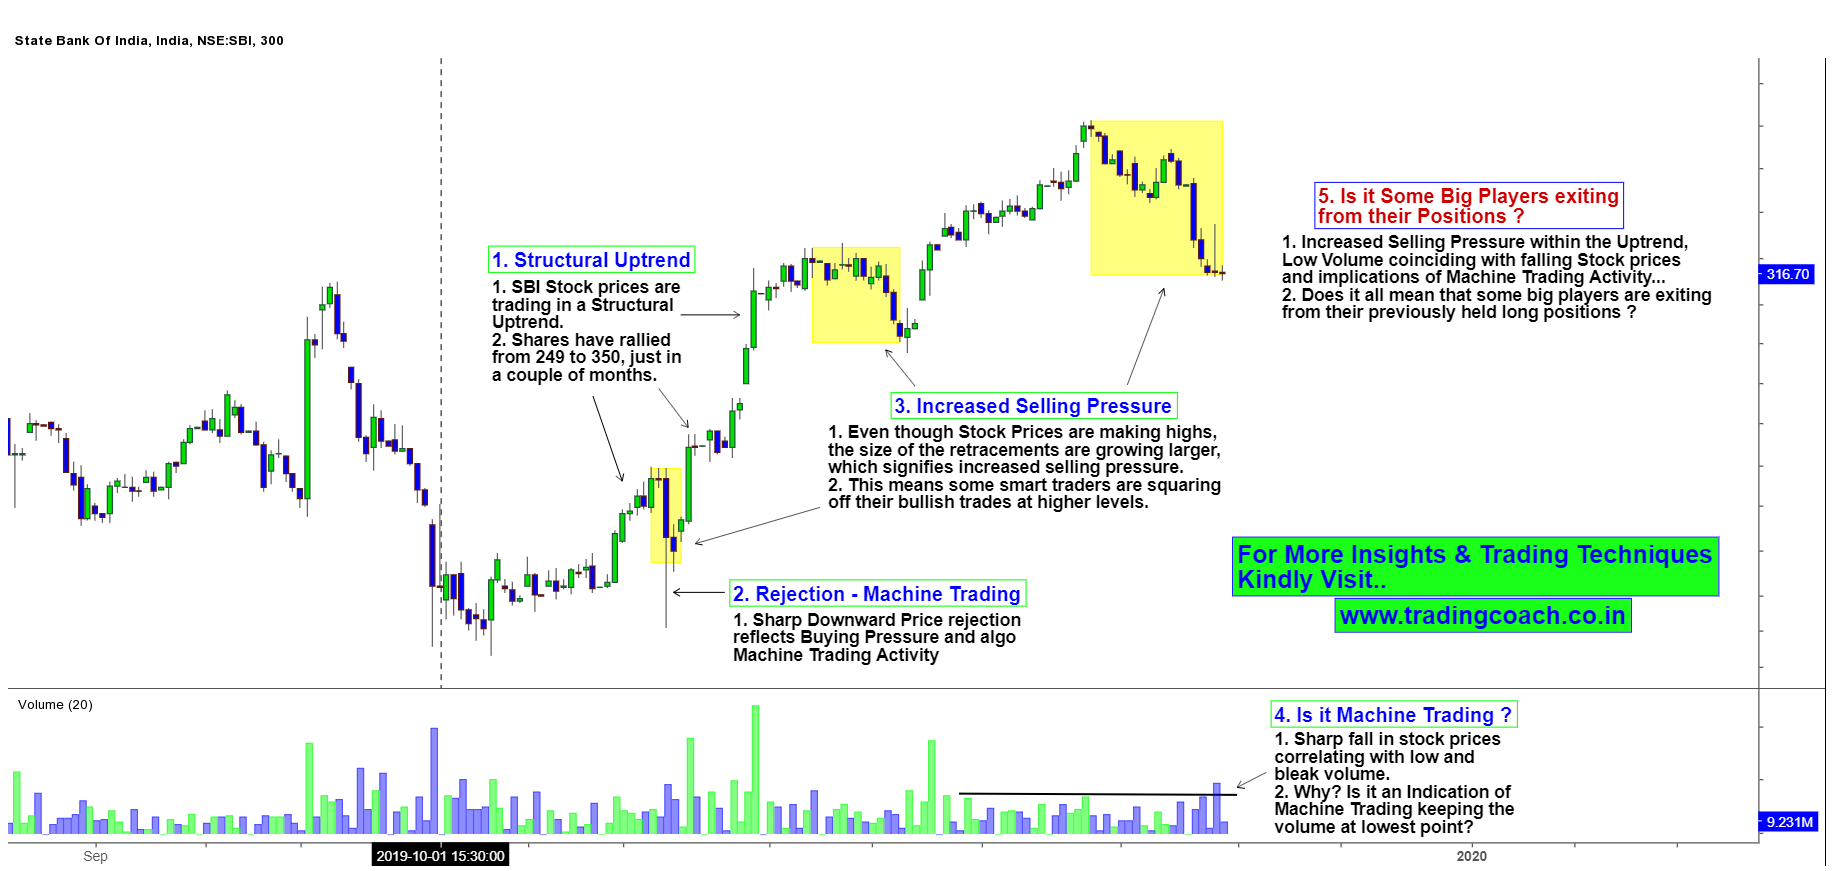
Overall Stock Market is sluggish from last couple of Months due to poor economic growth and geo-political issues. Only a handful of stocks are trending higher, out of that only very few of them are large caps. Surprisingly SBI is one of them. Since from October, SBI share prices are trading in a Structural Uptrend and have rallied all the way from 249 to 350. A closer examination of the Uptrend reveals some interesting facts that are playing out in SBI Stock Prices. Take a look at the Price Action Analysis on 5h chart.
SBI Price Action shows signs of Big Players and Machine Trading
Even though the Stock prices are in Uptrend, the retracement/pullback is growing larger after each consecutive high, which signifies increasing Selling pressure on the Stock. This type of Price behavior probably points out smart traders squaring off their long positions within the uptrend. Prominent Trader Richard Wyckoff would call this as “Operator Scaling”.
Another interesting fact is to notice the co-relation between Price Action and Volume. See recently how the stock prices experienced a sharp fall from 350 to 316. On the other hand, during the same period, trading Volume was very low and bleak. Is this a sign of Machine Trading Algorithms executing large orders and suppressing the volume?
So overall we can see different facts such as increased selling pressure in the Uptrend, Low volume correlating with falling stock prices and Machine Trading Activity etc. playing out in the Stock. Does it all indicate that some big players are exiting from their earlier long positions?
If that’s the case what will happen to this Uptrend? Will the trend reverse or would it continue? There are many possibilities; it will be interesting to see how things will unfold from here onwards. Traders should track the Price Action of SBI in upcoming days and should wait for more clarity before taking any key decisions.


