Coronavirus is one of the Biggest Black swan of the year. It unexpectedly shook the Financial Markets and affected the sentiment of Market Participants altogether. Even the International Monetary Fund recently stated that Covid – 19 outbreaks will slow down the Global Economic growth this year.
Given the large Impact of Coronavirus, it’s a good idea to track the Price Action of some major trading instruments to gauge its effect on the Markets. Such an outlook will help us to get a better perspective and take informed trading decisions.
USDINR Price Action on Daily Chart

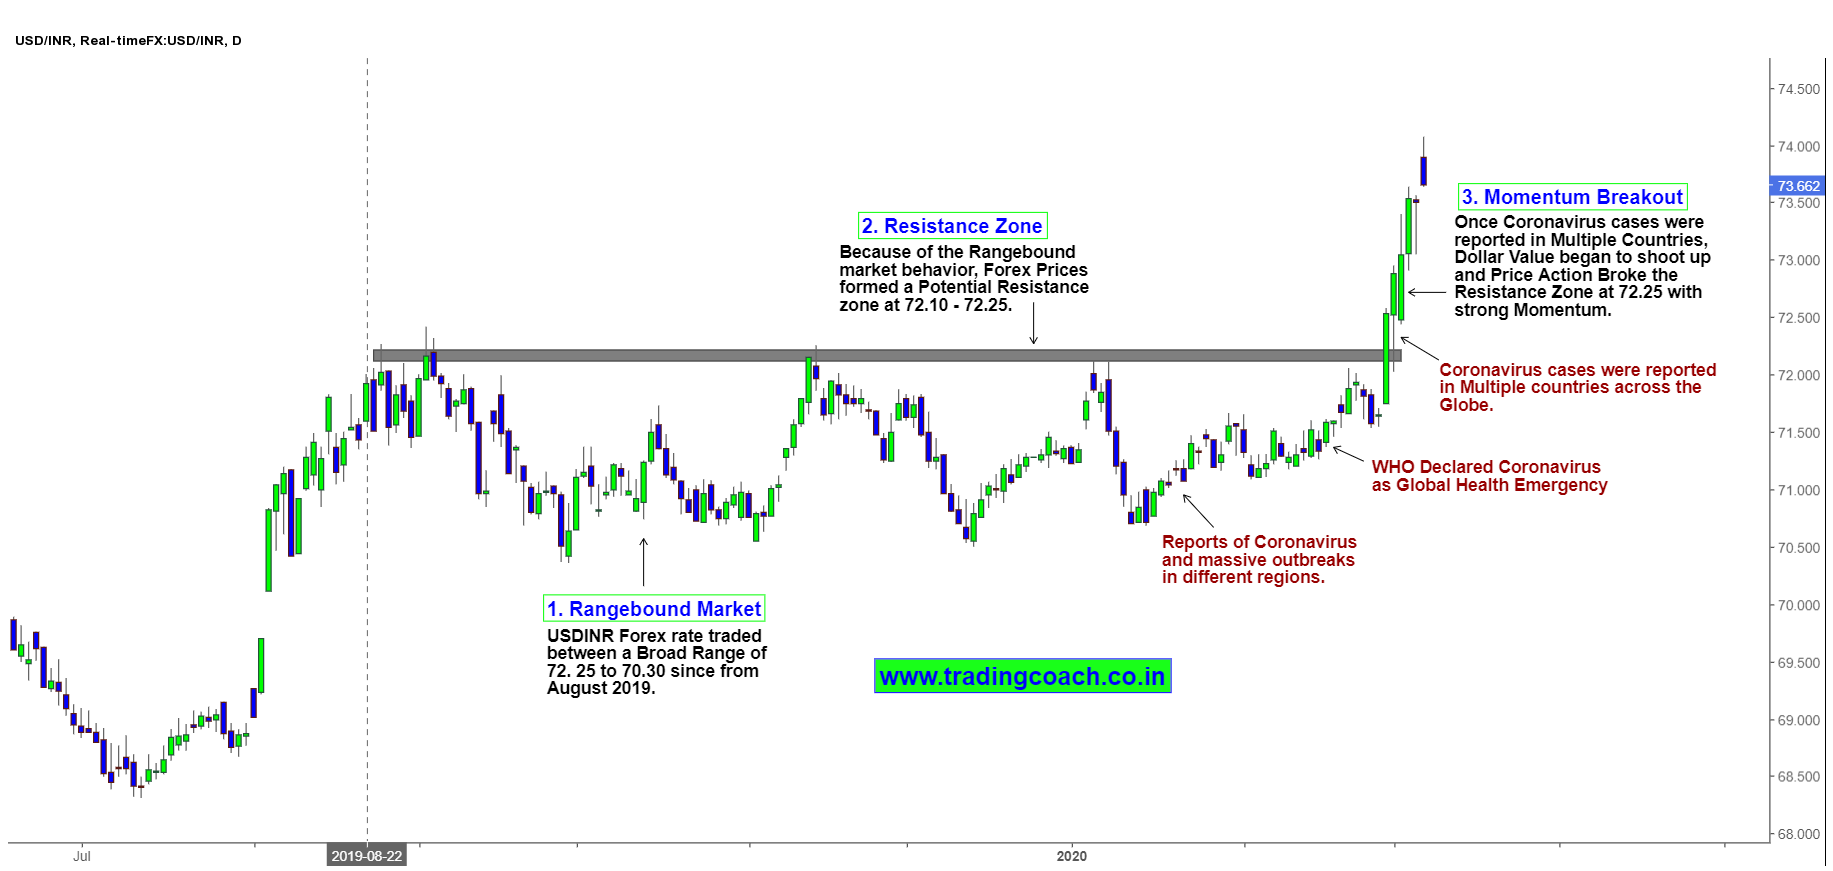
Dollar prices were not much sensitive to the initial events of coronavirus. When you look at the USDINR Exchange rate on Daily chart, it traded in a Broad range of 72.25 to 70.30 since from August 2019.
But once cases were reported in multiple countries across the globe, Volatility increased and Price Action broke through the Resistance zone at 72.25 with strong momentum. Mostly it’s because of the Safe heaven demand for USD. Since it’s a global reserve currency, dollar prices have a historical tendency to shoot up during turmoil and crises.
Nifty 500 Price Action on Daily Chart

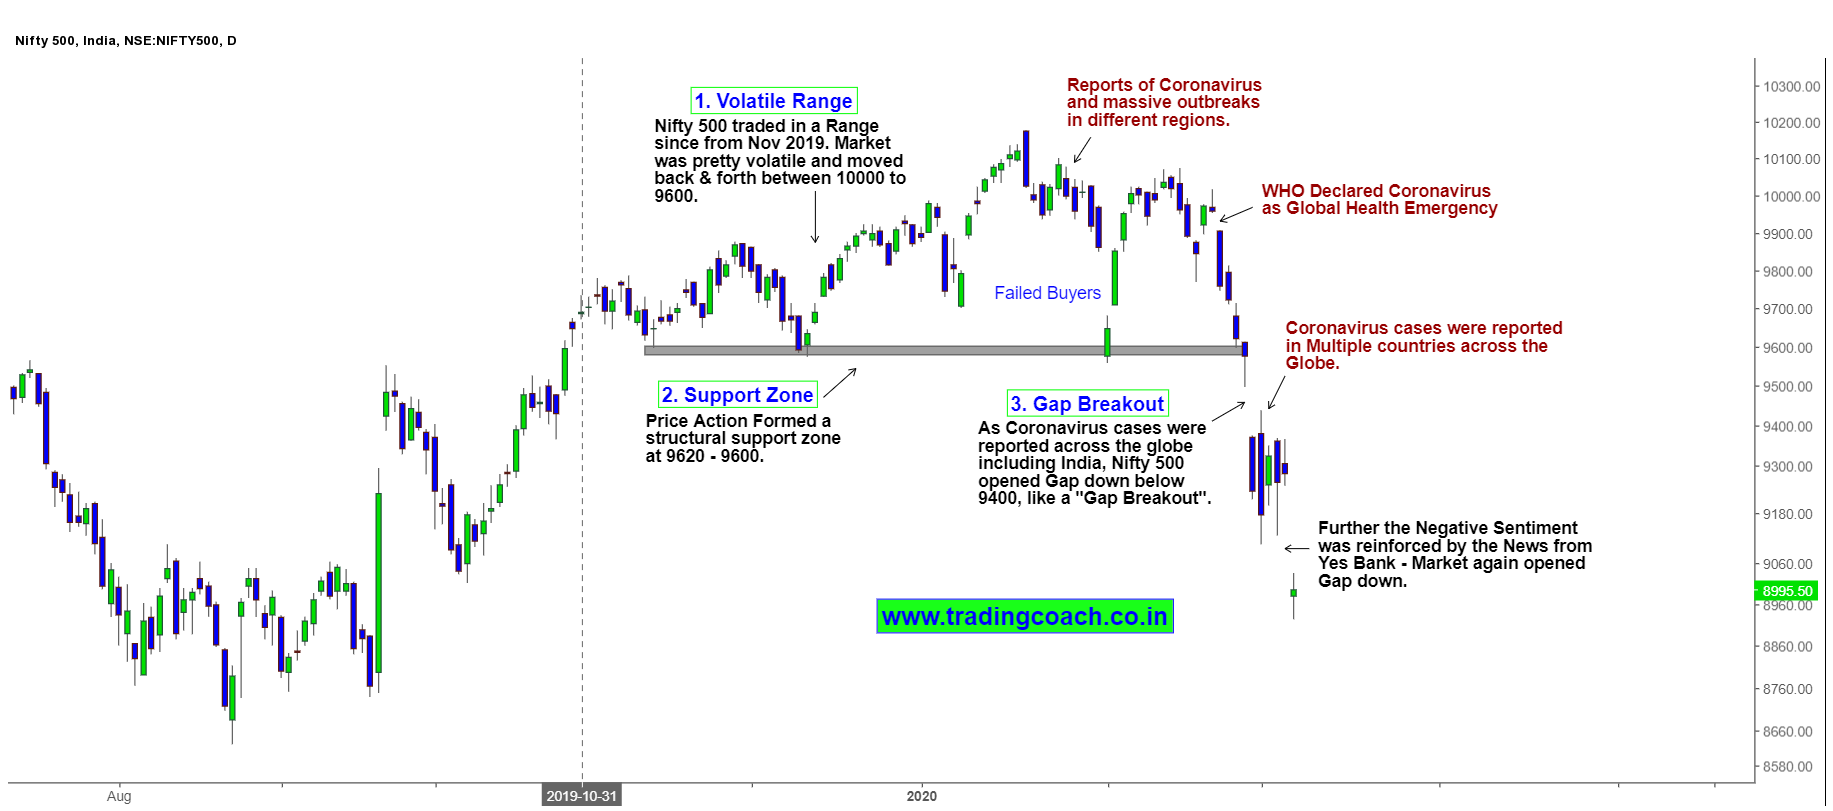
To gauge the effect of Coronavirus on Indian Markets, It’s better to look at the Price Action of Nifty 500 instead of Nifty 50. In one of my earlier article, I have already pointed out the limitations of looking at Nifty 50 to understand the Indian Stock Market.
Even from the beginning of 2020, Nifty was pretty volatile. Index prices traded back and forth between 10000 – 9600. When massive outbreak reports were publicized, foreign institutional Investors (FII’s) pulled out their investments and Price Action broke through the support zone at 9600. The negative sentiment was further reinforced by the news from Yes Bank which caused Nifty 500 to fall even lower, up to 8800 – 9000 levels.
Crude Oil Price Action on Daily Chart

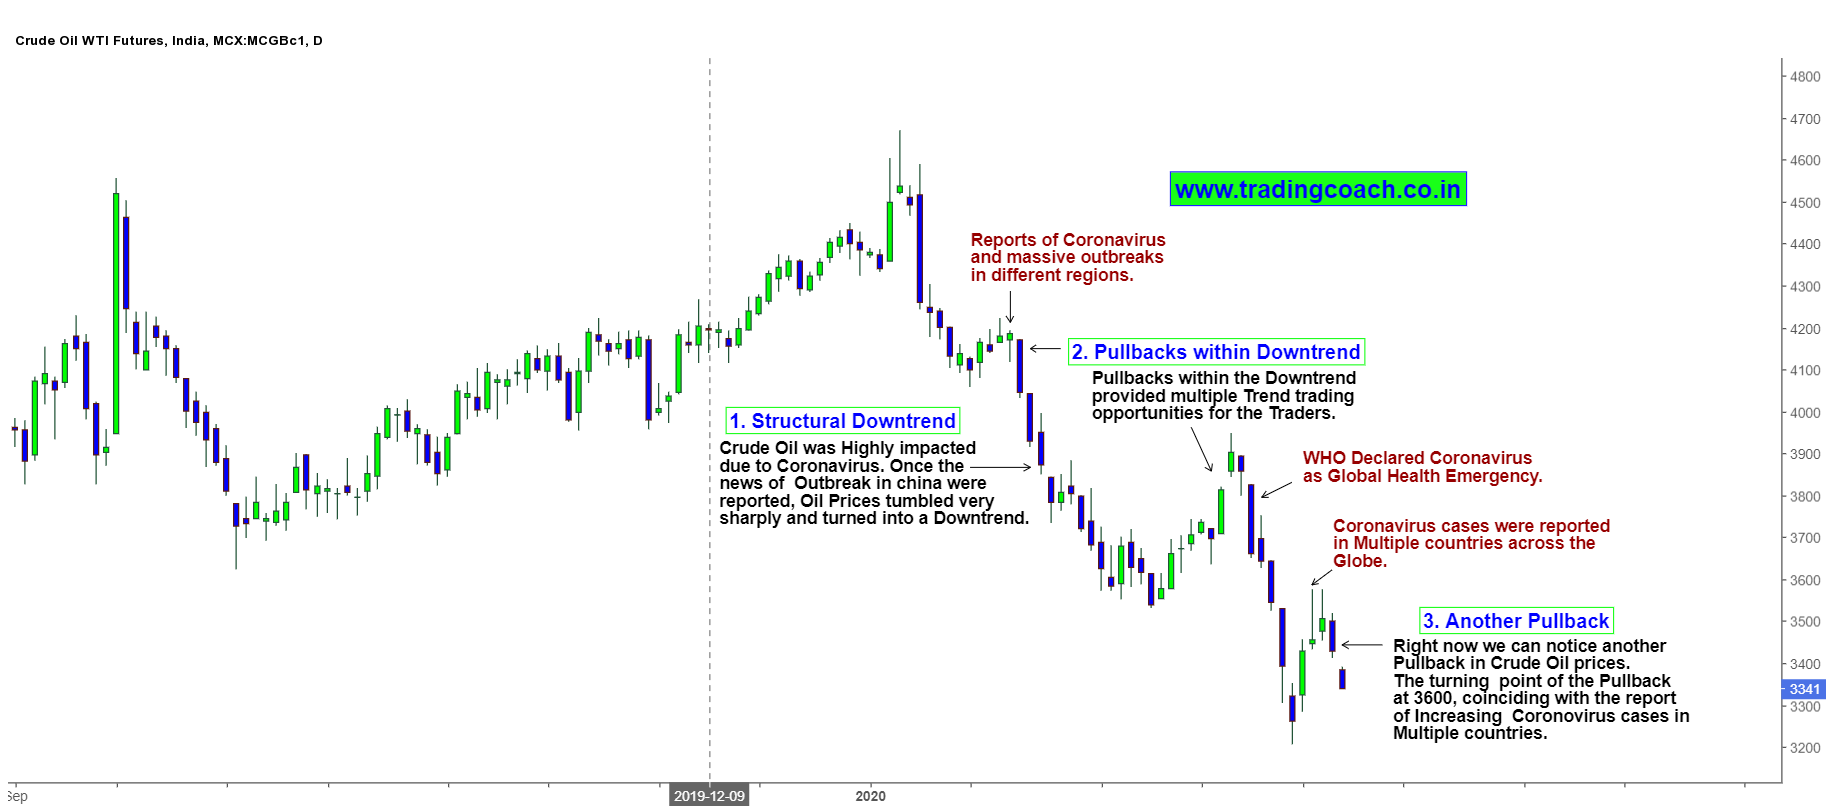
Out of all the Financial Assets, Crude Oil experienced the worst impact because of Coronavirus. Once the outbreak in China was reported, Crude Oil prices tumbled very sharply from 4350 and turned into a structural downtrend. Right now it’s trading around 3300 levels. Based on the measurement, Crude Oil has lost almost 25% from its peak value.
But for the Short sellers, Pullbacks within the downtrend on both higher and lower time frames offered multiple trend trading opportunities. Even right now, we could notice another pullback shaping up in Crude Oil daily chart.
S&P 500 Price Action on Daily Chart

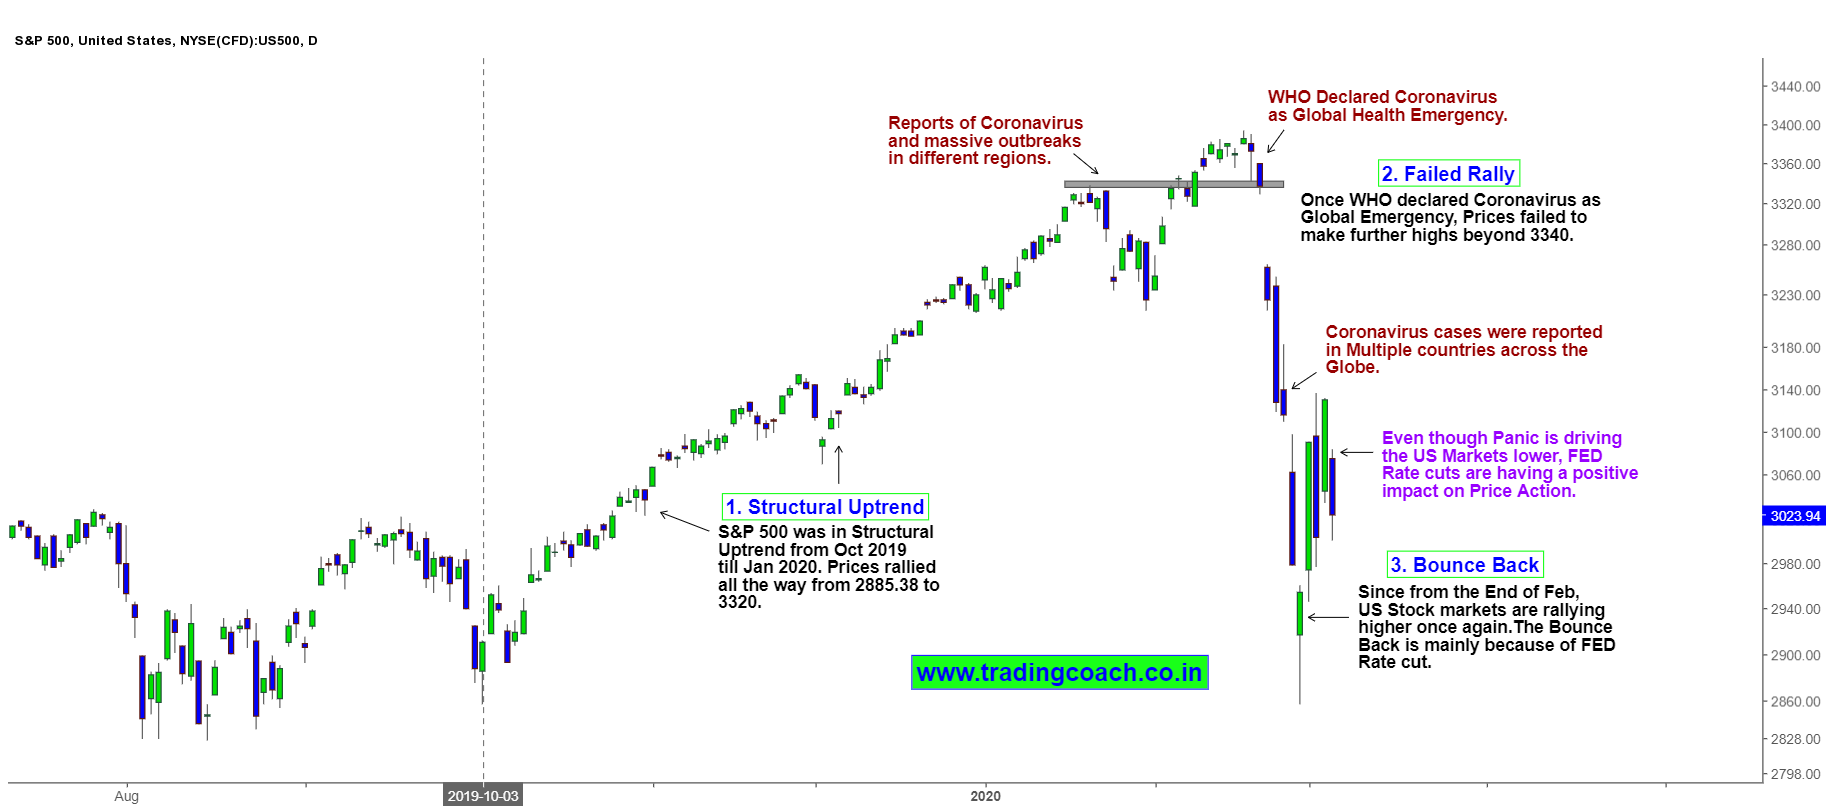
US Markets had a kind of mixed reactions to the events of Coronavirus. In the initial stages of the report, S&P500 tumbled sharply from its peak value of 3340. Once WHO declared Coronavirus as a Global emergency and when US reported domestic cases, Index prices fell all way down till 2900. But from the End of Feb, S&P 500 is rallying higher once again, mainly because of FED rate cuts.
Even though panic is driving the US markets lower, FED rate cuts are having a positive impact on the Investor sentiment and Price Action. Given the Mixed market behavior, it’s necessary to track the development in S&P 500 to get more clarity.
So that’s the status of Major Financial markets so far. It will be interesting to notice how these assets will perform once they develop a vaccine for coronavirus. Another important fact is to keep an eye on the FED and other central banks, who might step in with more policy measures. Once the fear of Coronavirus subsides, then the Global market sentiment might completely depend upon Central Bank policies.


