Since the beginning of 2022, we can only notice consistent rallies in BOB share prices. The draw downs and selloffs are not that big. So far, Bank of Baroda stock prices have climbed up to 42% since the beginning of this year!
Take a look at the Price Action Analysis on the 5h Chart to understand the complete picture.
BOB Share Prices on 5h Chart
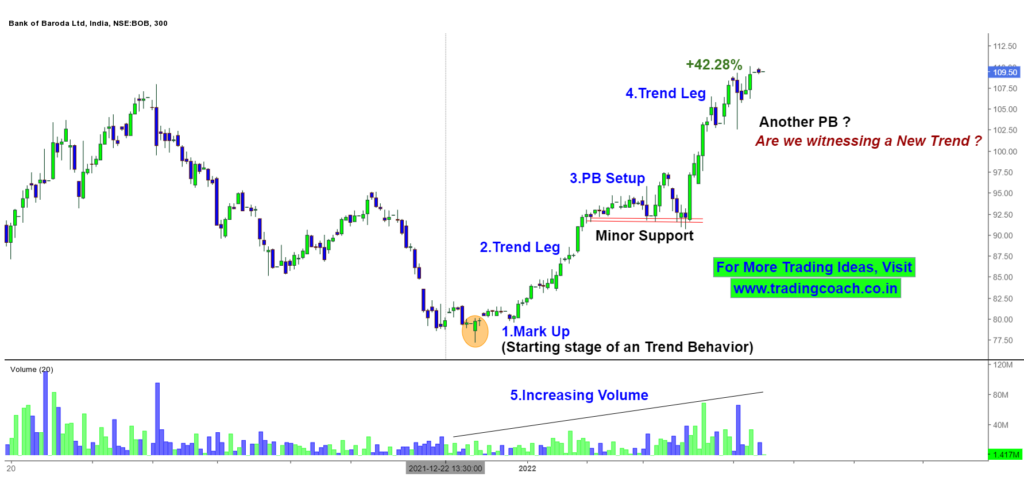
When we see the chart, we can notice that Price action resembles the starting stage of an uptrend. It can also be referred to as a Markup Phase.
Stock prices have rallied so far from 77.50 to 110. The momentum behind the rally looks pretty decent and strong. Even the volume is consistently increasing alongside the Price action.
So from these observations, can we say, it’s the beginning stage of an uptrend? Traders should keep an eye on the price action and look out for the Possibilities of Trend Development.
We can look to initiate trades based on Pullbacks and Retracements if the price action turns into a complete uptrend. Keep the Bank of Baroda stock on your watch list for the upcoming days.