

Price Charts are powerful tools for Traders for chart reading. Read the previous sentence clearly-It’s just a tool for reading the markets. We need to think deeply about the chart reading and what it represents. With my experience, I would define charts as “Statistical picture of Market‘s movement”. Most traders use charts without understanding the purpose. This is a Paradox. Some use price charts to trade hardcore chart patterns or bury them alive with indicators. Just Like this
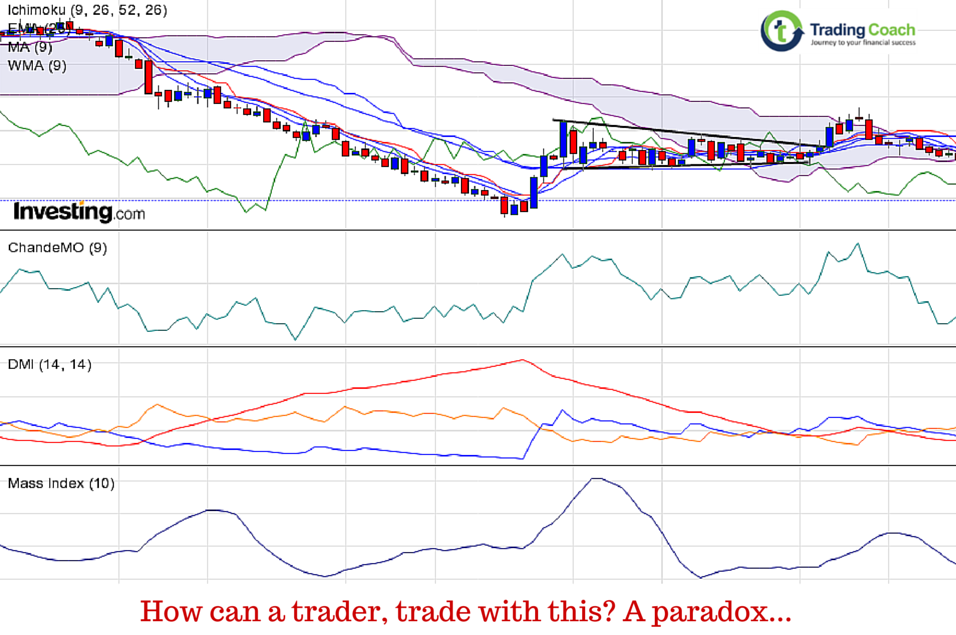
If this is the case then, how does this leads to a successful trading and profitable results? Trading is a business, just like anything else. Even though it is possible to trade like this, Similar approaches always leads to disastrous consequences. Sooner or Later depending upon these kinds of systems will blow the account.
THE SKILLS OF CHART READING
Reading charts is a skill. When I mean by chart reading, I am talking trading with naked price charts without indicators or with minimal indicators. Naked chart reading provides richness and depth of analysis that are available to a skilled trader. Top level trading is a mental process. Successful traders combine their left brain skills of logic with right brain skills of pictorial thinking. Traders need to be intuitive, creative and deductive. Charts are analysed by right brain (pictures) and deducted using left brain (logic). The edge for a trader lies in learning this skill of combining both left brain and right brain. Once traders understand the market’s message and psychological tone, they will be successful in rationalizing profitable opportunities.
SIMPLICITY IS THE KEY TO SUCCESS
As a trader, everything I do has simplicity and consistency. Trader should put his focus on price bars, Key levels and Price action to understand the Market’s tone. Any indicator that helps us to do this is good, where anything that distracts us from achieving clarity should be avoided. Consistency means order, is also important for a trader, due to 2 different reasons.
1) It helps in efficient time management.
2) Improves your learning curve.
Simplicity and consistency is must and should for a trader. In other words, keep things simple and in order.
SOME BASIC TIPS ON CHART READING…
BAR CHARTS OR CANDLESTICK CHARTS WHICH ONE TO CHOOSE?
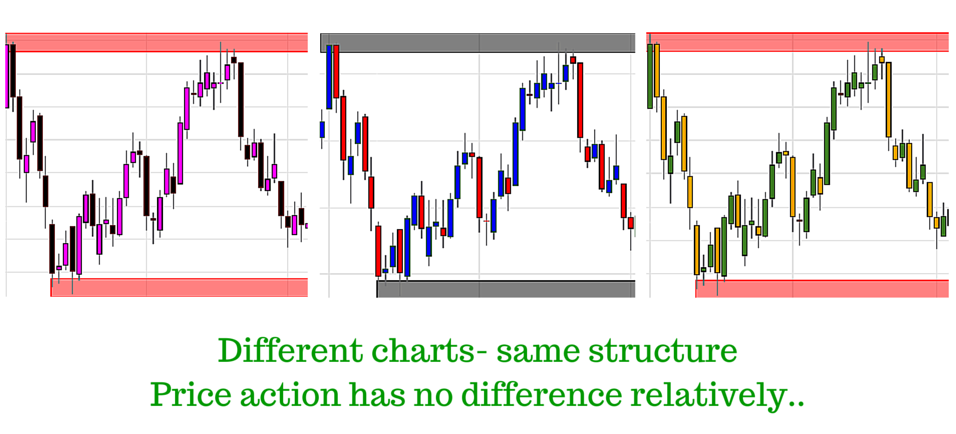
Any of these charts are perfectly good. Whether it is candlestick charts or Bar charts .Chart reading has nothing to do with format of the charts. You can read price action in any format. Price action is not exclusive to candlestick charts. Remember, Richard Wyckoff used old school line charts to understand price action and Market psychology. All charts display market’s tone- whether it’s bar chart or candlestick chart. Most traders today are using candlestick charts- The reason is candlestick charts are visually neat and good.
I suggest using candlestick charts; it makes more visually appeal to read buying and selling pressure in the Market.
INDICATORS
Indicators are derivative of Price. Usually in context, they’re lagging. There are different types of indicators and most common in use such as Moving average, Oscillators, Price bands and Volatility. Most commonly used indicators are useless or have little value. Smart traders are minimalist, using few or no indicators at all. Some traders, usually beginners make mistake of constantly switching between indicators. There is no Holy Grail or systems that’ll lead to easy profits. My suggestion is to understand the tools before you use them. Think how they’ll react to different market conditions. Keep very few indicators, if necessary (around 1 or 2). I don’t use any indicators in my trading style. But sometimes I rely on Exponential Moving average to visualize the trend.
CHOOSING THE BEST TIME FRAME
Traders must wisely choose the time frames by considering their external restrictions. Such as Career, Jobs, Lifestyle, Market hours, Health issues etc. Time frames are connected deeply with trader’s personality. My trading ideas can be applied on any time frame,whether you’re an intraday trader, Swing trader or Positional trader. Nearly all the traders consider higher time frames in their trading strategy.
Relatively there is no difference between price action on any time frame..
My suggestion as follows
Intraday trader – 15 Minutes and 1 hr Time frame
Swing trader – 4h and Daily Time frame
Positional trader – Weekly Time frame only
There is no magic in this combination of time-frames. Reason for this kind of allocation is to make sure it fits trader’s personality and his style. Usually above mentioned time-frames provides a mental edge for traders.
COMBINING MULTIPLE TIME FRAMES
Many books are written about the advantages of combining multiple time frames. Multi time frame chart reading can give complete advantage and tell about patterns on a single time frame.
Nearly all technical traders consider price action and market structure on higher time frames. Price action traders do this in a variety of ways. Some traders derive information from a single chart, while other look at multiple charts showing different time frames of the same instrument. In such cases, one can divide timeframes into 3 different parts. Primary time frame or focus time frame called as TTF (Trading time frame). HTF (Higher time frame) chart will give big picture-perspective. LTF (Lower time frame) charts will help us on entry and exit points.
In general time frames should relate each other by 3 to 5 ratio. For instance, if a trader is watching a 30 minute candlestick, a 5 or 10 Minute chart will provide context for price action, happening inside the Candlestick. The idea behind such an approach is to extract necessary information without repetition or lose relevant price action. Multiple time frames are important for chart reading.
BOTTOMLINE
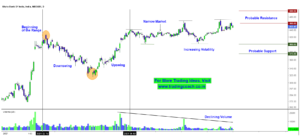
When it comes to chart reading, there’s no one right way. In this article, I have emphasized on basic chart reading tips based on my experience. Everything I do is on the context of clarity and consistency. The purpose of chart reading is to find trading opportunities. When you see a chart, you want the market’s message as the first and most important thing your eye should catch. Any calculated measures or enhancement or any rules are just a supplement to understanding Market’s tone.

1 thought on “Basic Chart Reading Principles and Guide”
nice