Trend trading is a popular strategy and it’s a notable technique. Whenever the prices make consistent higher highs, or when the prices make consistent lower lows, they try to capture those one-directional market movements.
But do you know where exactly most of the Trend traders lose money? Or where most of the technical analysis fail? A Spot where most of the technical indicators don’t work?
So in this Content, We are going to see where exactly we are not supposed to do trend trading and we’ll see where exactly most of the traders will lose money.
Whether you are a trend trader or whether you’re just using indicators, you need to understand this Price Action concept and it’s very important. – It is known as Trend Contraction.
So What exactly is Trend Contraction?
When prices change from Trend to range or consolidation – Whenever the market Prices move from Trending markets to Range bound markets or consolidation, that is where we see trend contraction.
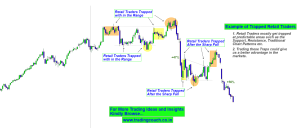
Trend Contraction is where most of the Traders lose money!
If you can understand this concept very well, It will help you to protect your capital and you can avoid making unwanted losses. You can avoid Trading at the spot where most of the losses usually take place for technical traders.
So let us look at the examples of trend contraction taking place in both SBI and HDFC Bank Stock Prices.
SBI – Trend Contraction on 5h Chart
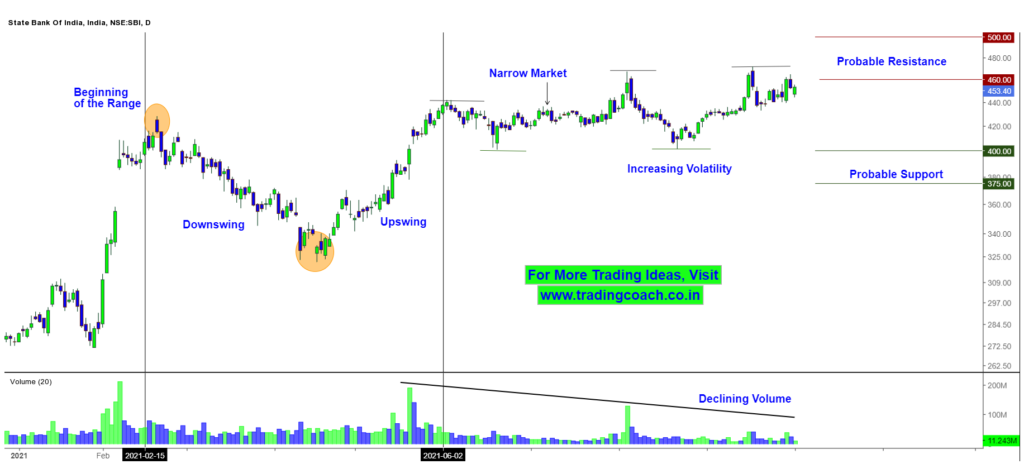
As we can see the Stock Prices, Trend has failed to make further highs at 440. The pullback that has taken place around that level has changed into a consolidation. Volume has declined consistently. This type of unexpected shift in the Price Behaviour must have trapped many traders. This is a Good example of Trend Contraction.
Why do you need to pay attention to Trend Contraction?
By Paying attention to Trend Contraction, you can avoid extreme losses that occurs when the market conditions change from Trend to Range. Not only that, you can avoid getting trapped where most of the other traders are likely to get trapped.
Also you’ll precisely know where most of the Indicators and Technical Trading systems can fail. By avoiding to take trades in such circumstances, you can indirectly increase your trading returns.
Conclusion
Trend Contraction is a sign of Price Action changing from Trend to Range
When you notice a Trend struggling or failing to make new highs, it could be a sign of Trend Contraction. Most of the traders who follow indicators and trend trading strategies will get trapped in Trend Contraction.
You need to avoid taking positions or you must close any Existing positions in Trend Contraction.
Be Careful when you notice such kind of Behavior Next time!