

Aftermath an extended Rally in the beginning of 2017, Copper prices unfolded into a range bound – Mean reversion Market structure. Prices struck within a range of 2.90 – 3.20 almost from the beginning of Sep 2017. The scenario is clearly visible on Daily chart. Buying and selling pressure is equal and there’s no imbalance in Market action (Price action must show imbalance in asset prices to trend, absence of imbalance means market is in equilibrium).
Copper Price Action on Daily Chart
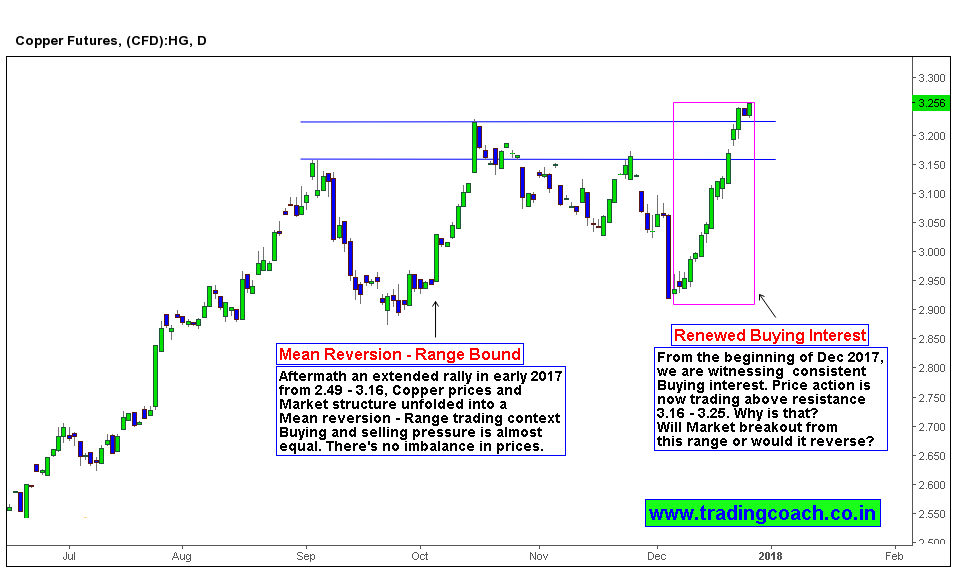
But from the Beginning of December, we have witnessed consistent Buying interest in Copper. If we look at the Candlesticks on Daily chart, we can only notice green candles for this entire month so far. Prices are now trading above the resistance zone 3.16 – 3.25.
What’s the reason for this renewed buying interest in Copper? Copper Prices have gained nearly 30% this year because of positive global economic outlook. Improving global economic growth is the catalyst for rising copper prices. Apart from that, increasing infrastructure demand in developing countries and fresh demand from Electric Vehicles (for Battery development) has kept the sentiment Optimistic. If the same narrative continues in the coming weeks then Copper prices will rally further.
Commodity traders should keep an eye on Copper daily chart as the resulting Price action might give a breakout or else a Breakout Failure Opportunity to initiate swing trading positions. Also focus on important Fundamentals which might impact the Prices in future.


