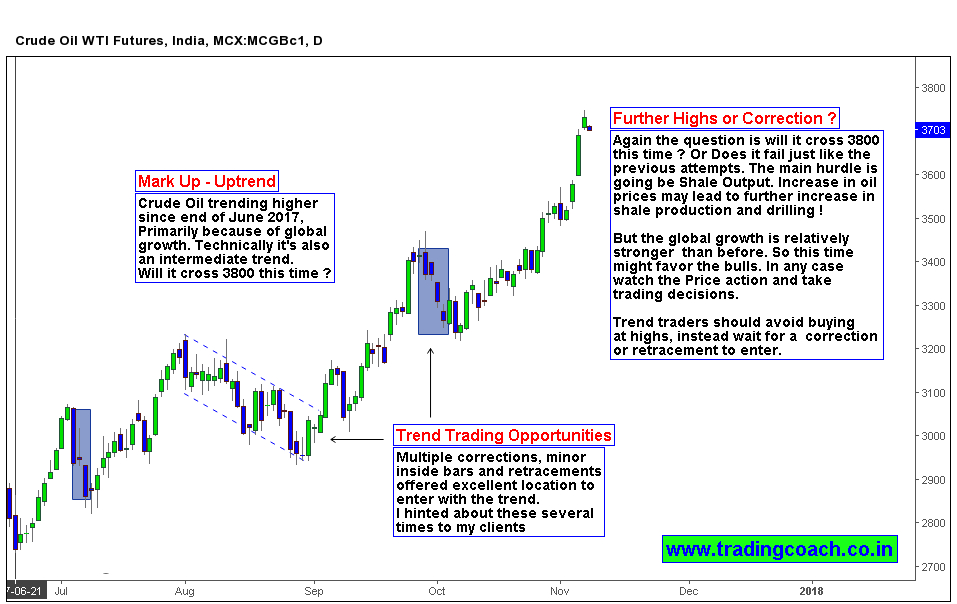
Crude Oil prices are trending higher from end of June 2017; the trend is still in place and reflects the optimism of market participants. Guessing Market psychology of commodities is relatively simple if market prices are in trend. When we look at the daily chart, it’s easy to spot the Uptrend in Oil Prices. The trend is intact from 4 – 5 months, technically making it as an intermediate uptrend. Intermediate uptrend is an Indication of changing market sentiment.
Price action on Daily chart in Intermediate Uptrend
It appears that falling US rig counts despite rising oil prices and improvement in global growth made demand outlook better than before. Also OPEC’s production and disruptions in US Drilling activity due to hurricanes might have played a role in sentiment shift.
Range expansion traders and trend trading strategies are performing better in the current environment. From the perspective of Price action – multiple corrections, minor retracements and inside bars offered excellent setups to trade along with the trend. I have hinted about these setups multiple times to my clients and students. Also it’s obvious to notice that the rise in Prices is devoid of volatility suggesting that oil seems to be in silent bull market.
Now the question remains whether it would cross 3800 this time? Or does it fail just like the previous attempts? The main hurdle for bulls is going be shale production output. Due to the positive feedback of rising Oil prices and increasing production rate, higher oil prices might again kick-start shale production and drilling. Traders must watch the price action and keep an eye on Inventory reports as well as production output. Trend traders planning to take trend continuation trades must avoid buying at highs; instead wait for a corrections or retracements to enter.
