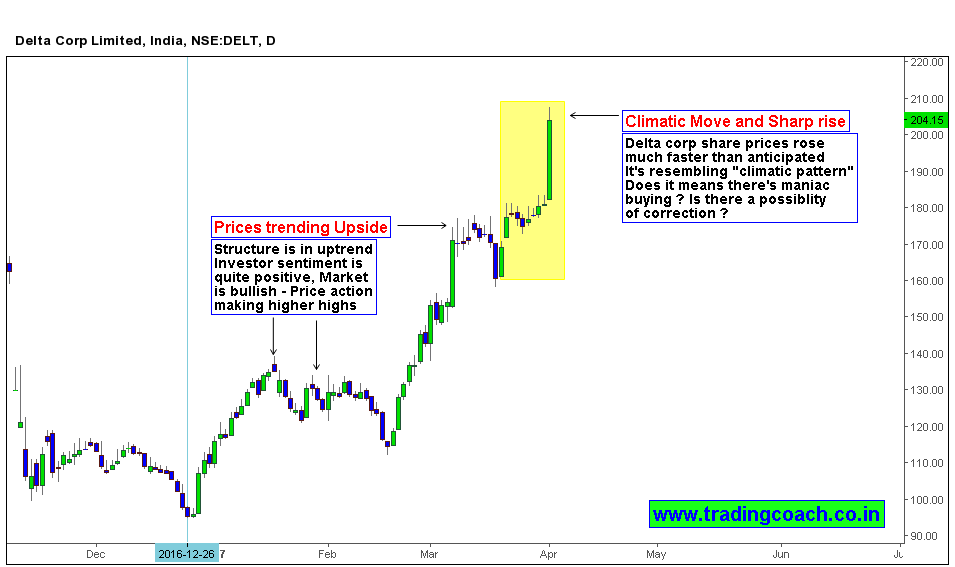
Delta corp share prices are flirting with resistance level 200.00, which also an psychological round number. From the beginning of this year, stock was in underlying bullish tone. The positive sentiment was further reinforced by regular fundamental news and events. Price action made higher highs, Shares rallied from 95.00 to 200.00 within a span of 4 months. Investor sentiment was optimistic on the stock throughout the period. When we closely observe the recent price behavior on daily chart, it resembles a climatic pattern. Does it mean there will be a correction in coming days?
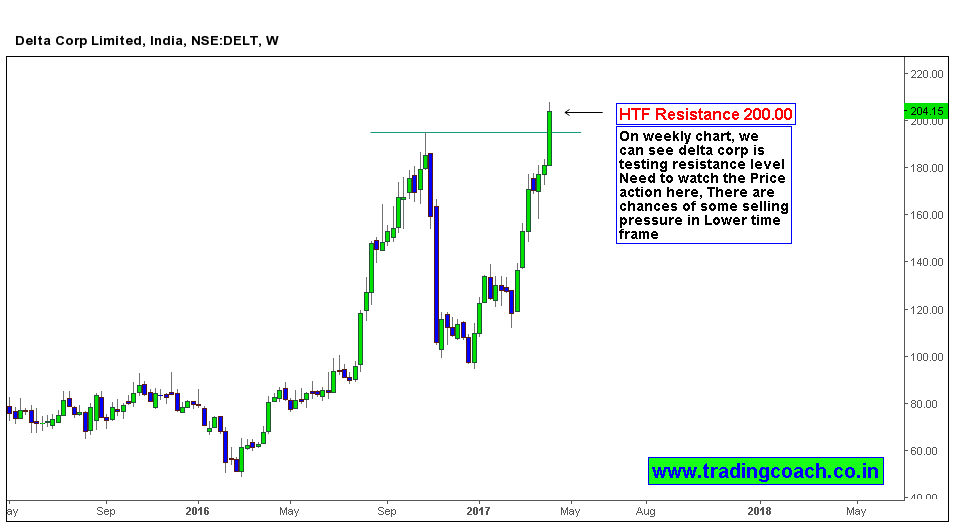
Looking at the weekly chart, the market structure becomes much clear. Price action is testing the HTF resistance level and structural high. There are possibilities of some minor correction in this time frame (normal market behavior is to retrace after moving near major highs or lows). If there is a minor correction in weekly chart, it might seem quite big in lower time frames like 4h and daily chart due to market fractals. The climatic pattern on daily chart is also coinciding with what we see here. I will be watching price action in coming days and will trade accordingly.


