Spot gold price action have surged 12 percent this year, rising above $1200 an ounce. Concerns over global economy influenced market participants to buy safe heaven assets such as gold. Upcoming demand and further economic uncertainty may add more gains to the precious metal. But some prominent speculators are unimpressed by the recent gains and note the rally as mere “short covering”.
The recent rally in gold indicates the potential to become a new uptrend. But buyer’s strength will be tested very often at the upcoming resistance levels. Buying pressure is still uncertain and casting a doubt over its sustainability. In the long term context, gold was consolidating around $1050 to $1080 since June 2013. Price action sent a lot of confusing signals, trapping the traders on both sides.
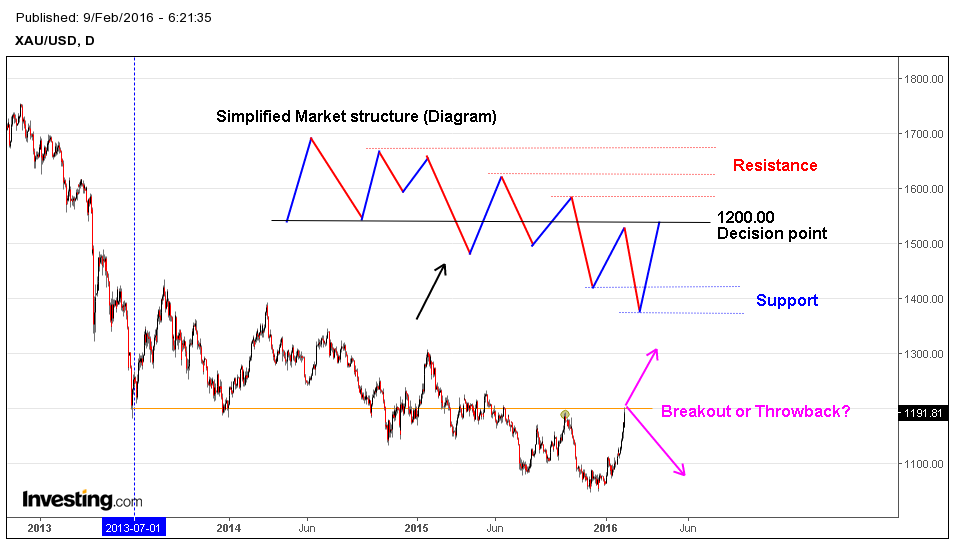
It’s subtle to note that, previously most bullish breakouts and rallies are met with decent selling pressures around strong resistance levels and flip zones. From a multi time frame perspective, Price action shows the strong resistance line, resting at $1225. Simplifying the choppy price action using swing analysis (Diagram) shows the complete picture of market structure. As we can see, market structure indicated the current setup in gold along with the structural formation of support and resistance levels. The resistance level at $1200 is a decision point, it provides clues about future direction of the price action.
Need to know about Market structure and swing analysis? Read here
Investors and traders should watch the price action at $1200 – $1225 closely. If price can stay above $1225, it’ll influence other market participants to initiate long positions. Watch the price action closely for further clues.
Important Resistance Levels:
$1200, $1225, $1300
Important Support Levels:
$1150, $1100, $1050

