

It’s been a while since I updated about ICICI Bank share prices. Here’s the recent outlook, the structure we’re going focus is the Downtrend in 4h Chart. Since from Jan, stock prices fell from the peak of 360.00 and tumbled till it made structural low at 260.00 in the month of April. By comparison of Price movements, shares have lost almost 35% from the peak value. From the perspective of Dow Theory, it’s a short-term trend (Downtrend duration is less than 3 months). 4h Chart of ICICI bank shows the Price action and Market structure in a very precise sense.
ICICI Bank Price Action Analysis on 4h Chart
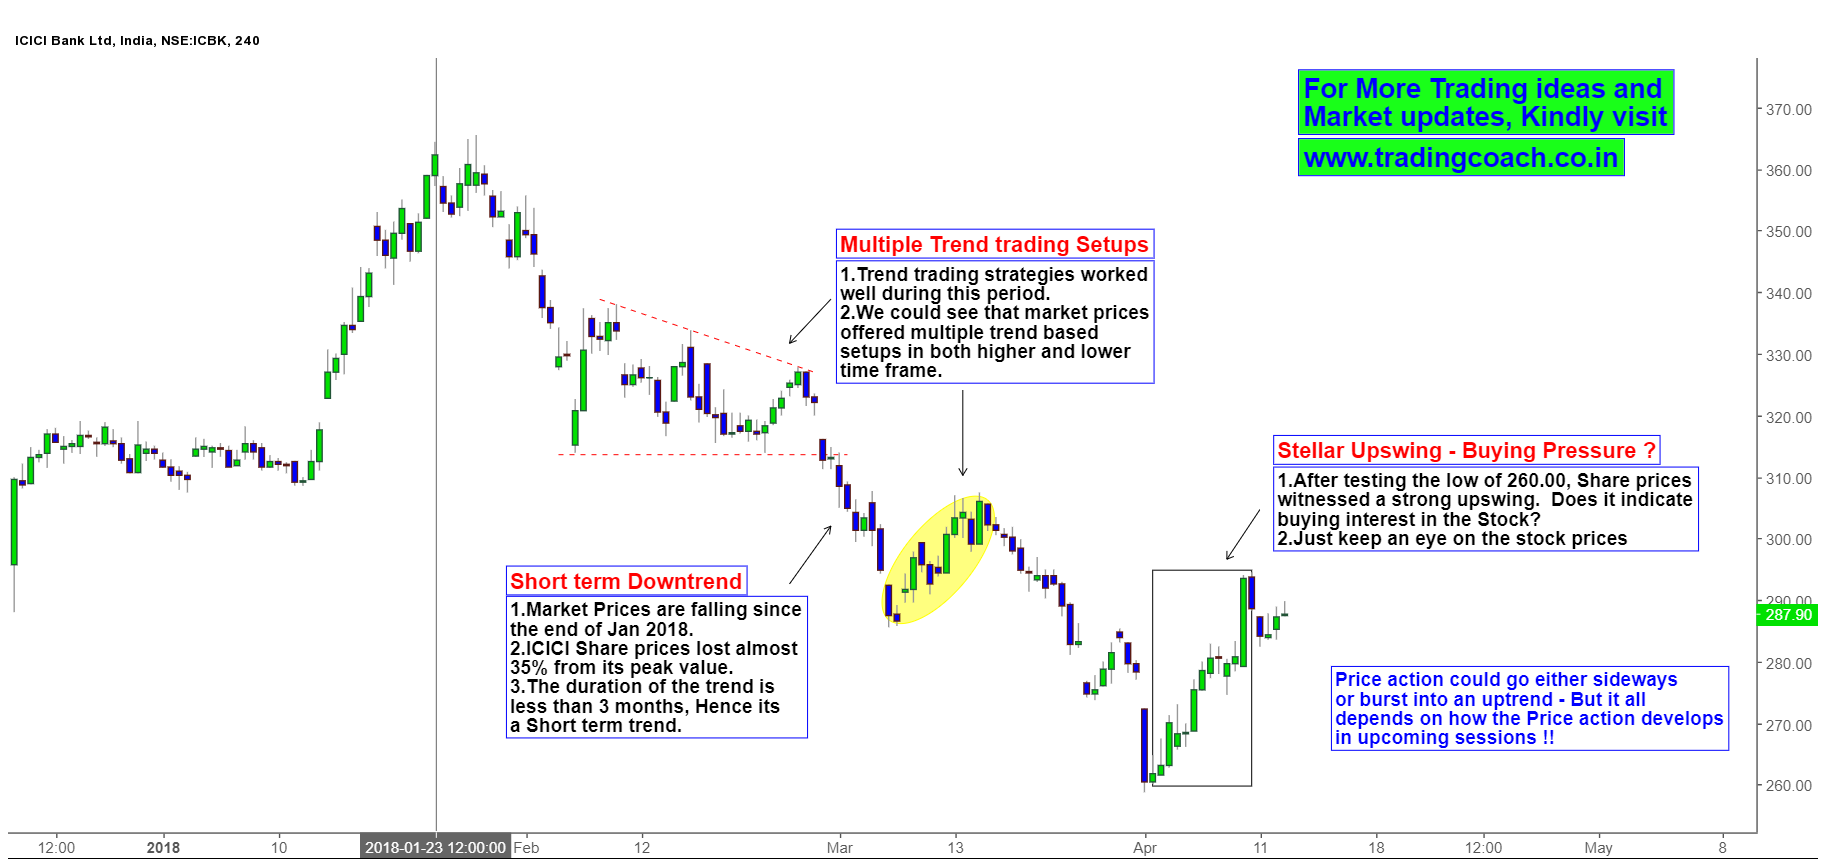
Throughout the period of last 3 months, Downtrend offered multiple trend trading opportunities for both higher and lower time frame traders. Short selling could’ve worked out better during this phase. As a result of the downtrend, Investors risk appetite declined and Volatility increased. But recent upswing we notice is challenging this structure. (Highlighted on the chart)
After forming a structural low at 260.00, Share prices saw a strong upswing. By looking at the upswing, we can infer the strength of buying pressure and order flow behind the price action. Does it show any buying interest in the stock? What’s likely to happen next? Market could either go sideways or may result in Trend reversal! Just observe the developing Price action and Trade accordingly.


