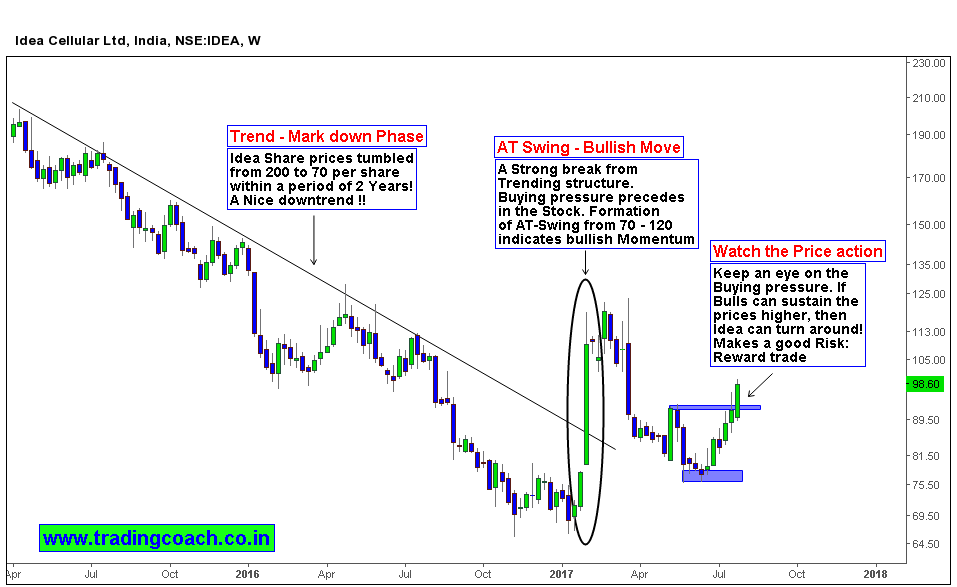
Price action reveals some interesting formation on Idea Weekly chart. Well the Reason I choose weekly chart over daily and 4Hr timeframe is due to clear Market structure. Noisy randomness – fluctuations are leading to false interpretation in both 4hr and Daily, whereas in weekly chart it’s pretty clear.
It seems like Idea share prices are turning around and poised to make sentiment shift. There are 2 Possibilities which might happen from here onwards, either the stock can go into a range or it can rally higher. (Of course, Prediction is not necessary to make a good trade!) But still one risk factor remains that can further push the prices downside – It’s the Jio Effect, No.2!
Idea tumbled from 200 to 70 per share value in 2 years. Final Injury happened when Jio unveiled it’s almost free data packs which shook the telecom sector and threatened the survival of many telecom operators. Idea felt those overwhelming consequences.
During the Same time, last trend leg of the earlier downtrend completed. After consolidating for 2 -3 months, price bounced sharply from 70 -120 resulting in AT Swing formation. Market action coincided with Vodafone – Idea Merger proposal. From last few trading weeks, Idea is witnessing good demand coinciding with CCI approval of the merger deal. Does it mean stock prices are finally turning around? Keep an eye on the buying pressure, if bulls can sustain the prices higher, it can make a good trade for Price action traders.


