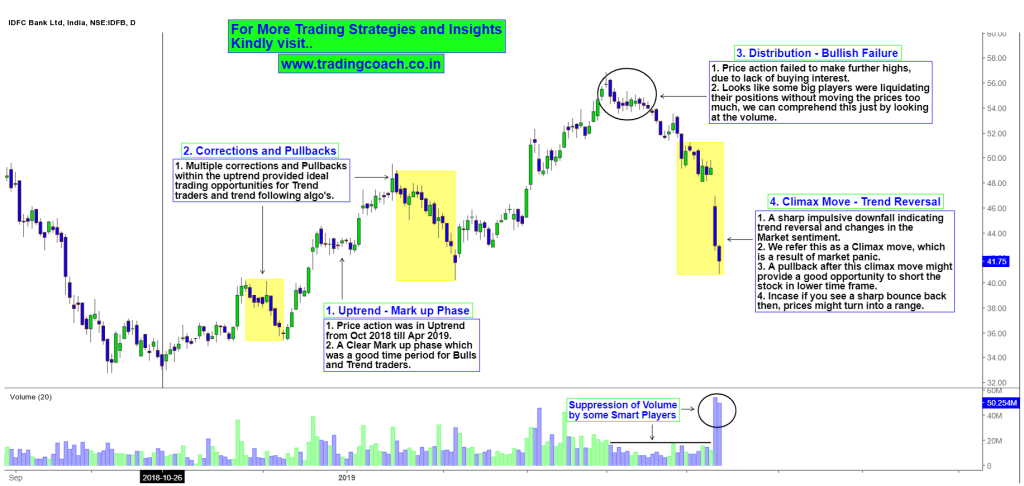
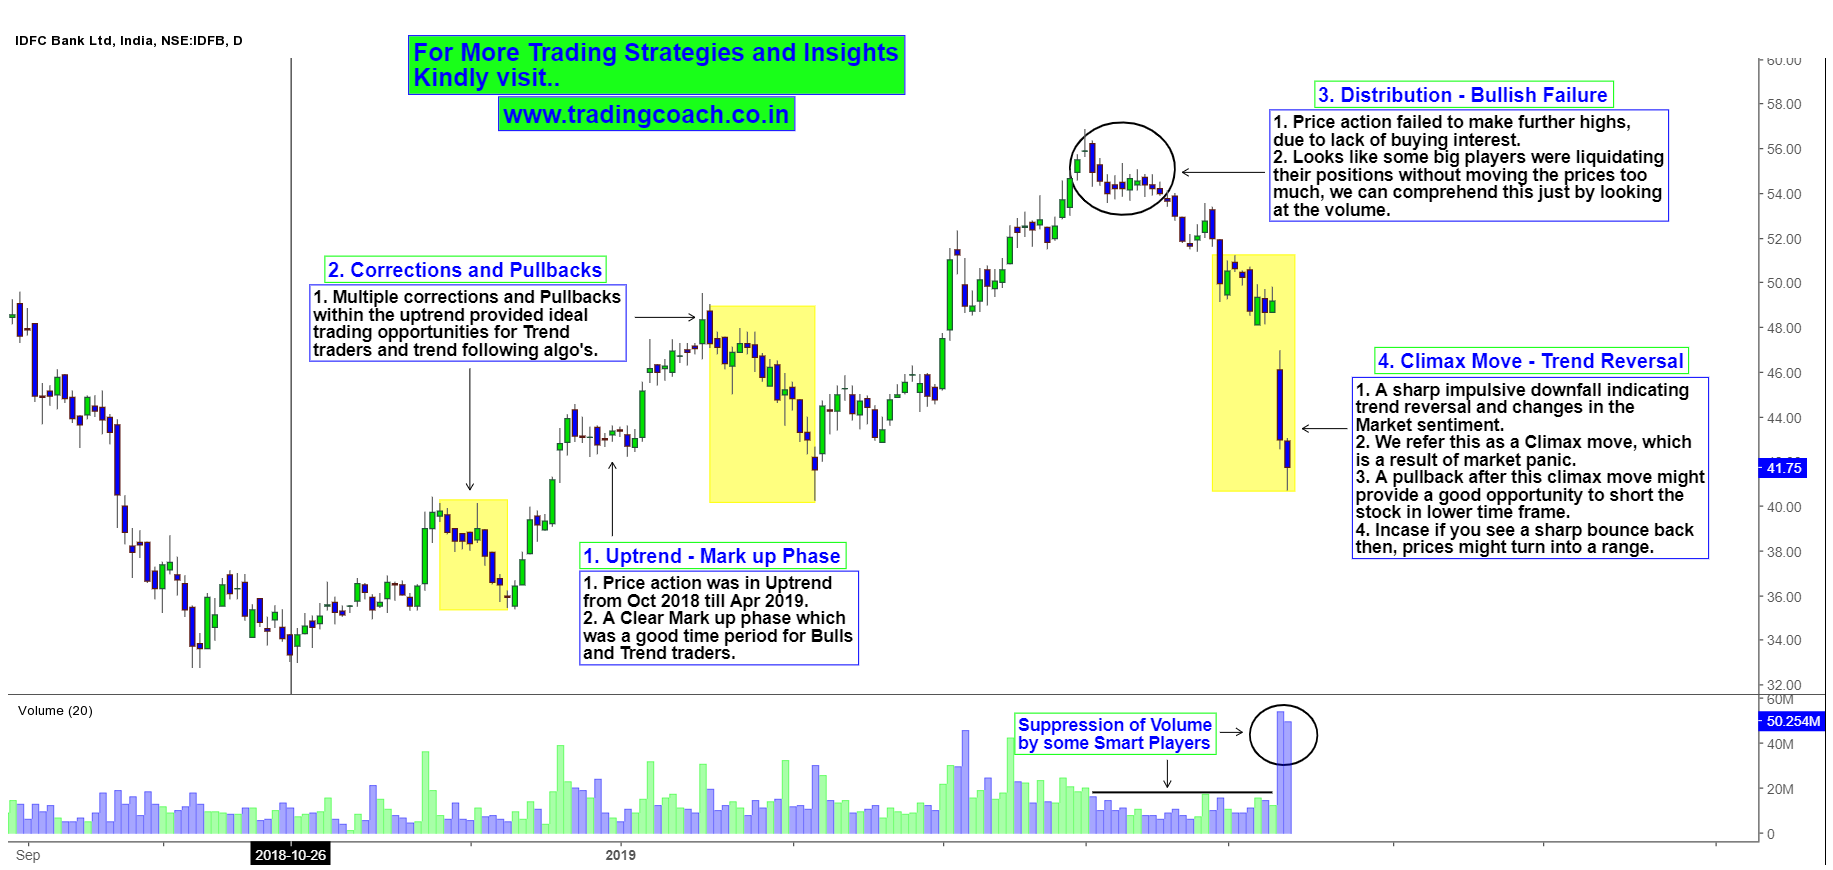
From last couple of days, IDFC Bank shares had a rough time. Share prices fell from 50.00 to all the way down till 40.00. In the daily chart, Price action is showing signs of trend reversal and changing market sentiment from last one week. Technically speaking, the entire selloff started when bulls failed to make further highs and couldn’t cross 58.00 price level in the beginning of April. If you notice closely at the tipping point, price action reveals a lack of buying interest and suppressed volume activity which might be a result of minor Distribution by some big players.
Incase if you’re wondering what is a Distribution, it’s a phase in which the smart big money players sell their holdings to small uninformed traders who are anticipating higher prices. At the end of distribution, smart big money players would’ve squared off all their positions and uninformed traders would get trapped when market conditions reverse. Take a look at the Price Action Analysis of IDFC Bank in Daily chart.
Price Action Analysis on Daily Chart
Volume Suppression by Big players
When you look at the volume, it stayed suppressed throughout the period. Looks like some big players were squaring off their previous positions without moving the prices too much. The suppressed volume that you see on the histogram is an indication of what’s going on behind the scenes. Later when the prices tumbled, you can notice a sudden increase in the volume which tells us that more sell orders were executed in the market.
Share prices are driven by the General Market Sentiment
Share prices were in uptrend during Oct 2018 to Apr 2019. During this period shares rallied all the way from 34.00 to 56.00. The uptrend was correlated with the movement of Nifty 50 Index. But it’s not the correlation we need to focus here; instead see how regardless of fundamentals such as balance sheet or asset quality, share prices rallied higher when the entire market condition was bullish. To be honest, as per some prominent research firms the fundamentals of IDFC bank is not so good, but still the shares rallied in relative to the general market sentiment during this period.
This specific scenario tells us about the importance of Market sentiment. Most of the time share prices are not driven by fundamentals or Technicals, but the overall market sentiment.
Trend reversal and Changing Market Sentiment
As of now, we can notice a sharp impulsive downfall in share prices which we refer as climax movement. Climax patterns are a result of market panic and indicate changing market sentiment. This climax movement is telling us that whatever earlier market trend was there has completely changed. A normal pullback after this climax formation can set up a good bearish opportunity for short-term traders. But if we witness a sharp bounce back in share prices, then price action might just turn into a range. So keep an eye on the Price action in daily chart and take trading decisions according to market sentiment.

