

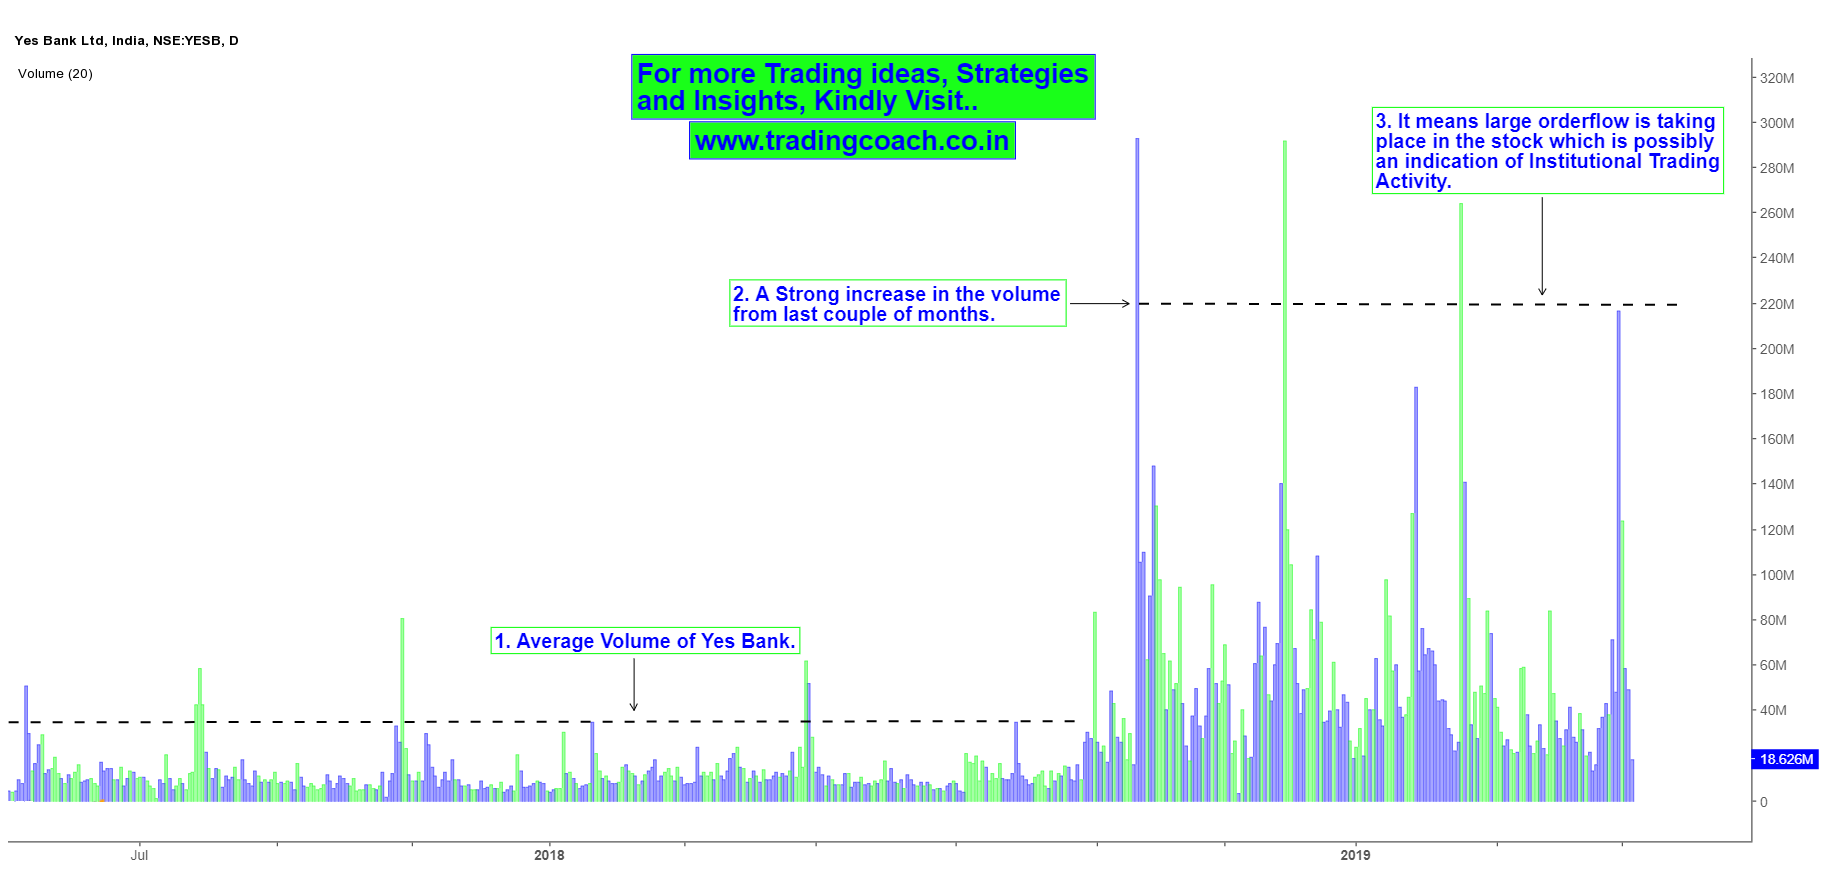
Something quite interesting is happening with Yes Bank. If you look at the historical volume of Yes Bank share prices, you can witness a strong increase in the turnover activity from last couple of months.
The average Trading volume of Yes Bank (based on historical data) is somewhere closer to 50 – 60 Million a day. But in the past 5 -6 months, volume has spiked up to 100 – 200 Million a day. It’s an indication that large orders are getting executed, which could possibly mean there’s some institutional trading activity taking place in the stock. Notice the changes in Relative volume of Yes Bank in Daily chart.
Relative Volume of Yes Bank
Apart from that, even Price action showed specific signs of Institutional trading process. Since October 2018, Yes bank share prices were trading in a range and prices tested the support zone at 165 – 170 multiple times. After each test, prices bounced back from the support zone along with increased volume – which is an indication of big players accumulating the shares.
To put it in simple terms, Accumulation is a process in which big players buy large quantity of shares carefully and skillfully, without moving the price. The small players are unaware of what is going on and often end up taking trades in the wrong direction. From a technical perspective, prices move in a trading range bounded by rough areas of support and resistance. To get an Idea of what I am talking about, take a look at the Price Action analysis of Yes Bank in Daily chart.
Price Action Analysis of Yes Bank in Daily chart
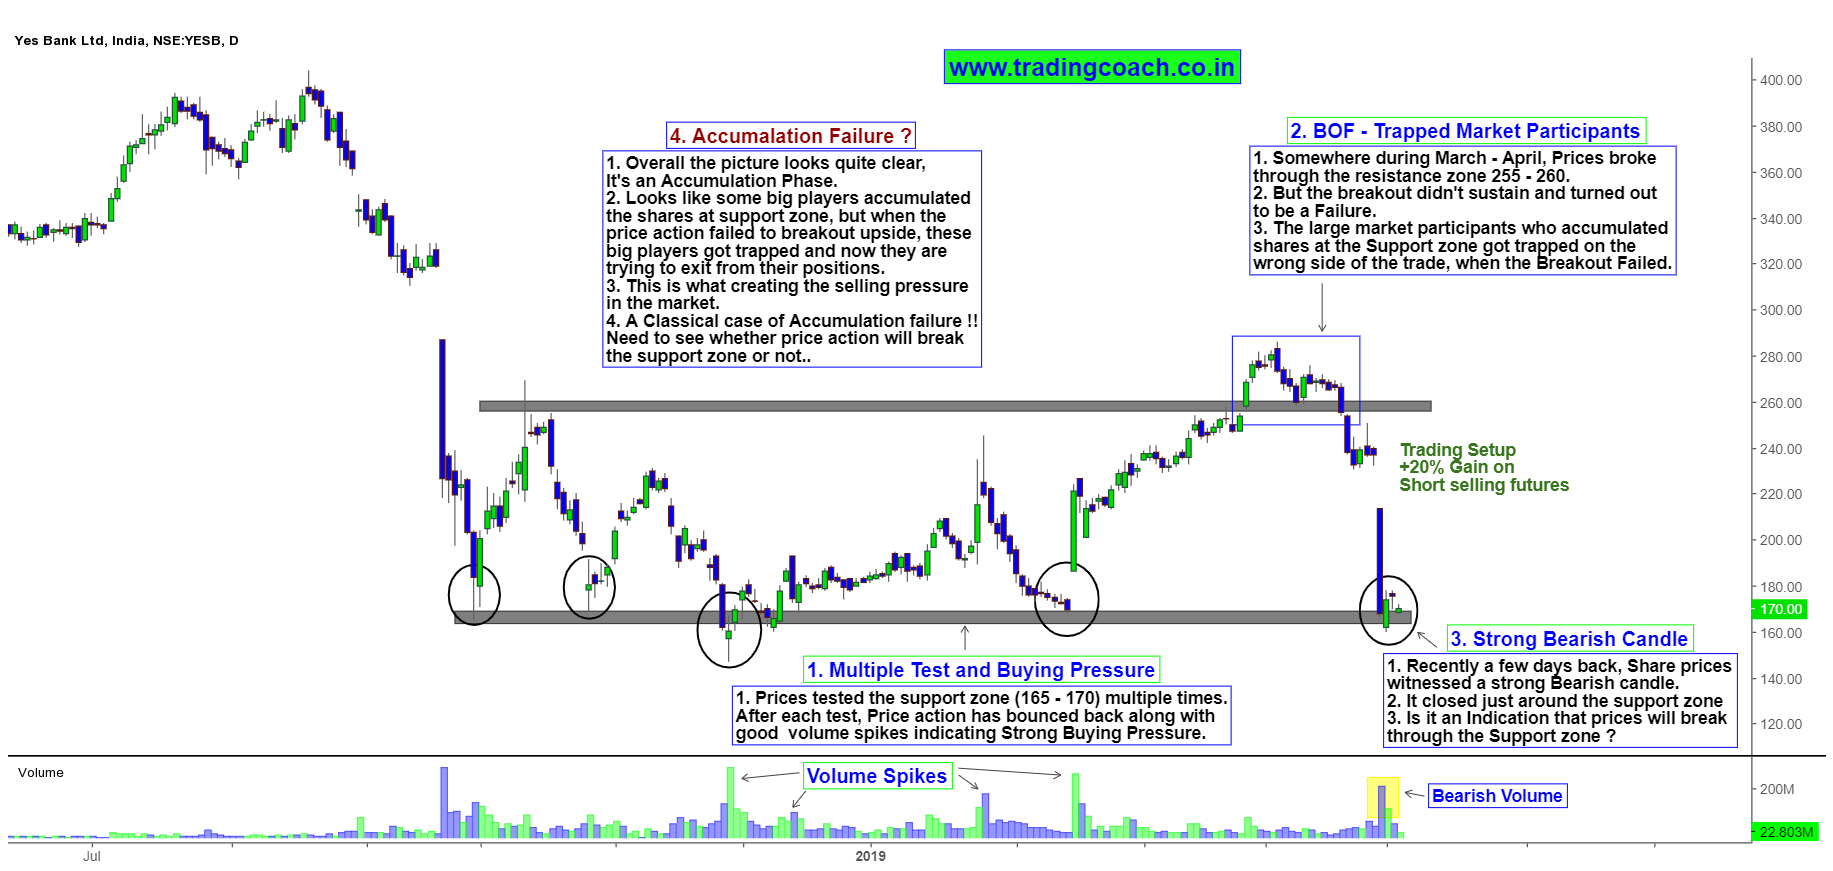
Is it an Accumulation Failure ?
As I pointed out in one of my earlier article, Accumulation doesn’t succeed all the time, sometimes even the Institutional players and their tactics will fail.
May be that’s the case with yes bank I guess. During the period of March – April, Bulls tried to break through the resistance zone at 255 – 260 but somehow the breakout didn’t sustain. Does it mean those large market players who’ve accumulated shares earlier got trapped by this False Breakout ?
Another important thing to notice is that, recently a few days back shares prices tumbled sharply and formed a strong bearish candle which closed just at the support zone 165 – 170 with increased volume. Is this strong bearish candle an indication that in upcoming days prices will break through the support zone? Has the Institutional players given up accumulating the shares?
Based on Price Action and Volume it seems like those large players who’ve accumulated shares in the range got trapped by the Breakout failure and now they’re trying to exit from their positions. It looks like a case of Accumulation Failure! If this entire trading range turns into an Accumulation failure, then prices might very well break through the support zone and tumble even further. If not then range might play out for few more weeks. In either case it’s a quite interesting structure, so keep an eye on the Price action in upcoming days and take trades accordingly.


